Stop Reading Dashboards: Eight Signals That Tell You What's Wrong With Code Review
GitQuick's Signals tab turns review metrics into a weekly playbook — deterministic checks, evidence-aware actions, PR drill-downs, and cross-run badges that show what's new, worsening, or stuck.
By Ahmad Hajjar
Most engineering managers can tell you their review metrics are "fine."
Median time to first review: four hours. Median merge: same day. Throughput looks steady. Nobody is complaining loudly enough to trigger a retro.
Then you open the Metrics tab and stare at twelve charts. Which number matters? Is the P90 spike new or normal? Is 22% merged-without-review acceptable for your repos, or a governance problem? You leave with more data and the same uncertainty.
That is the gap Signals is built to close.
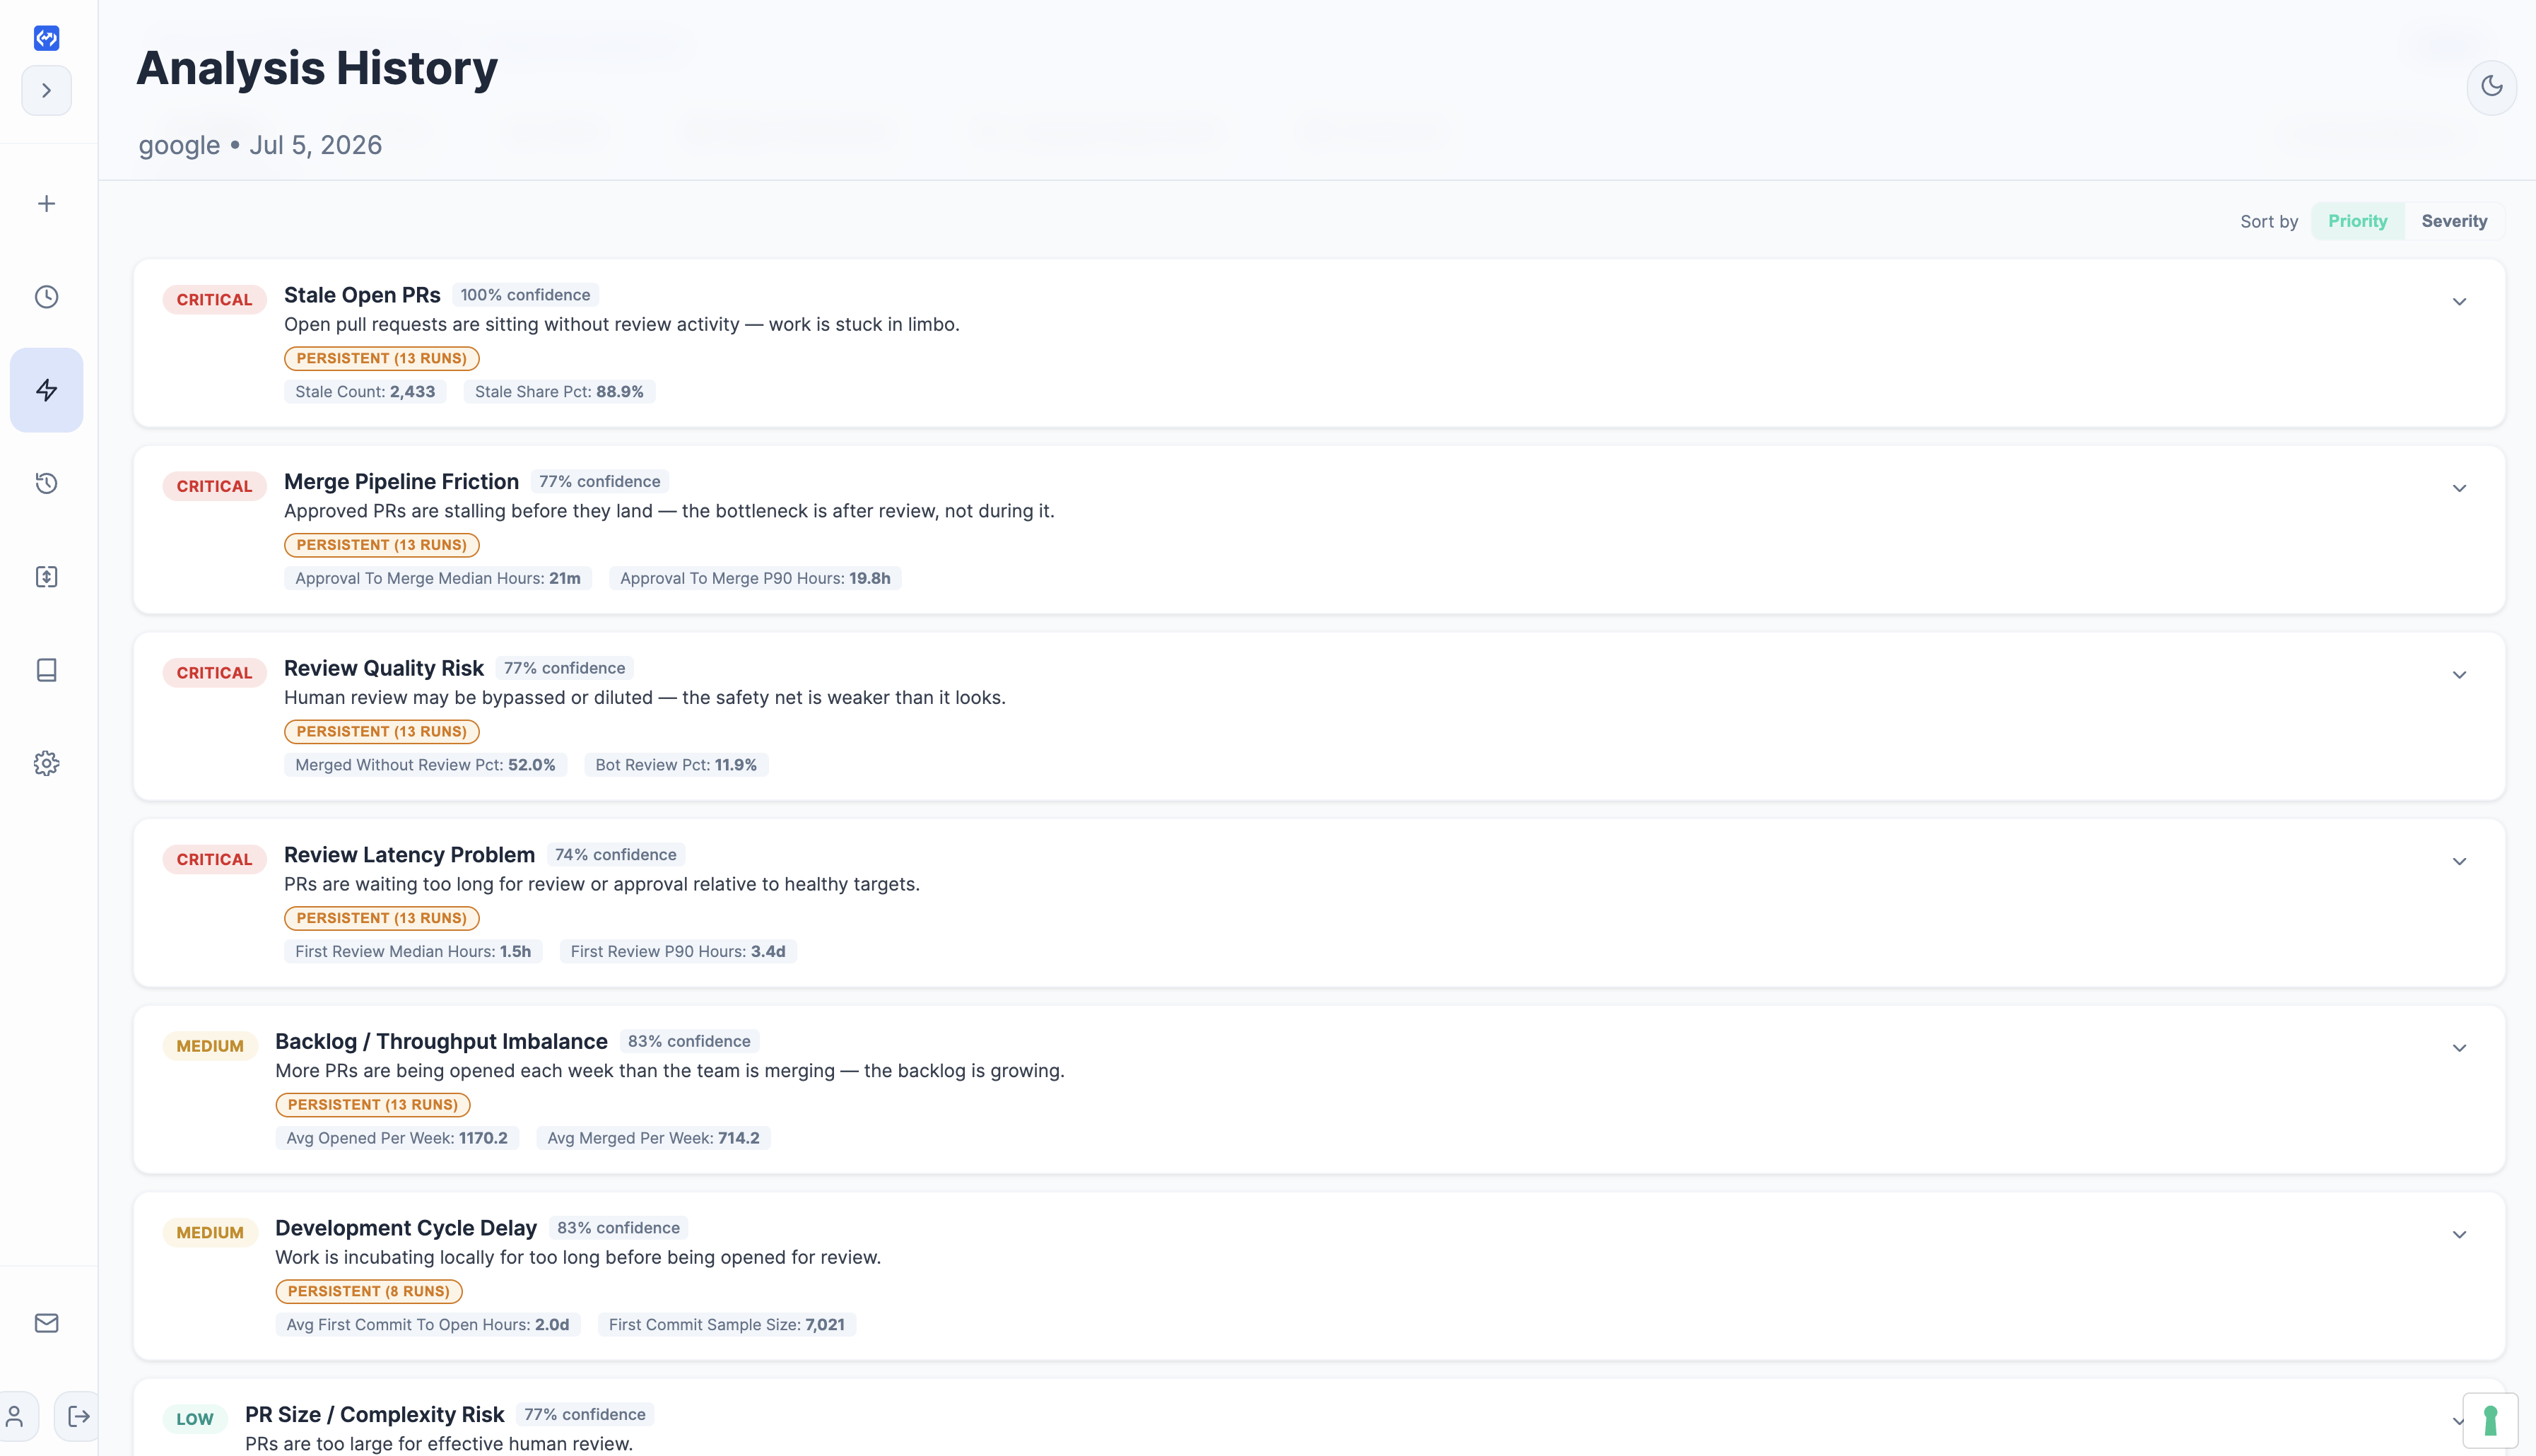
Metrics tell you what happened. Signals tell you what to fix.
GitQuick computes dozens of review metrics from GitHub pull request metadata: latency by stage, reviewer load, PR size, throughput, bot activity, and more — the same foundation as its GitHub PR analytics dashboard. Useful. Overwhelming at org scale.
Signals are the interpreted layer on top. Instead of asking you to read every chart, GitQuick runs eight deterministic checks against your run data and surfaces only the patterns that usually indicate a real process problem — with severity, confidence, evidence, and a recommended first step.
Think of it this way:
| Tab | What you get |
|---|---|
| Signals | "Here is what looks unhealthy, how serious it is, and what to try first." |
| Metrics | "Here are the raw numbers that back it up." |
Signals are deterministic. The same run data always produces the same signals. There is no LLM or randomness involved in detection — only fixed rules and thresholds. GitQuick is not guessing. It is applying the same checks every time so you can compare runs week over week.
The workflow: diagnose → act → investigate → track
The Signals tab is not a static dashboard. It is a weekly playbook.
1. Diagnose
Each triggered signal shows a severity badge (Low through Critical), a confidence score, and a one-line summary. Expand the card and you get interpretation, likely causes, and the numeric evidence that fired the check.
Why this fired chips show exactly which rules triggered — e.g. "Stale Count: 2400" or "Top-2 reviewer share ≥ 50%."

2. Act
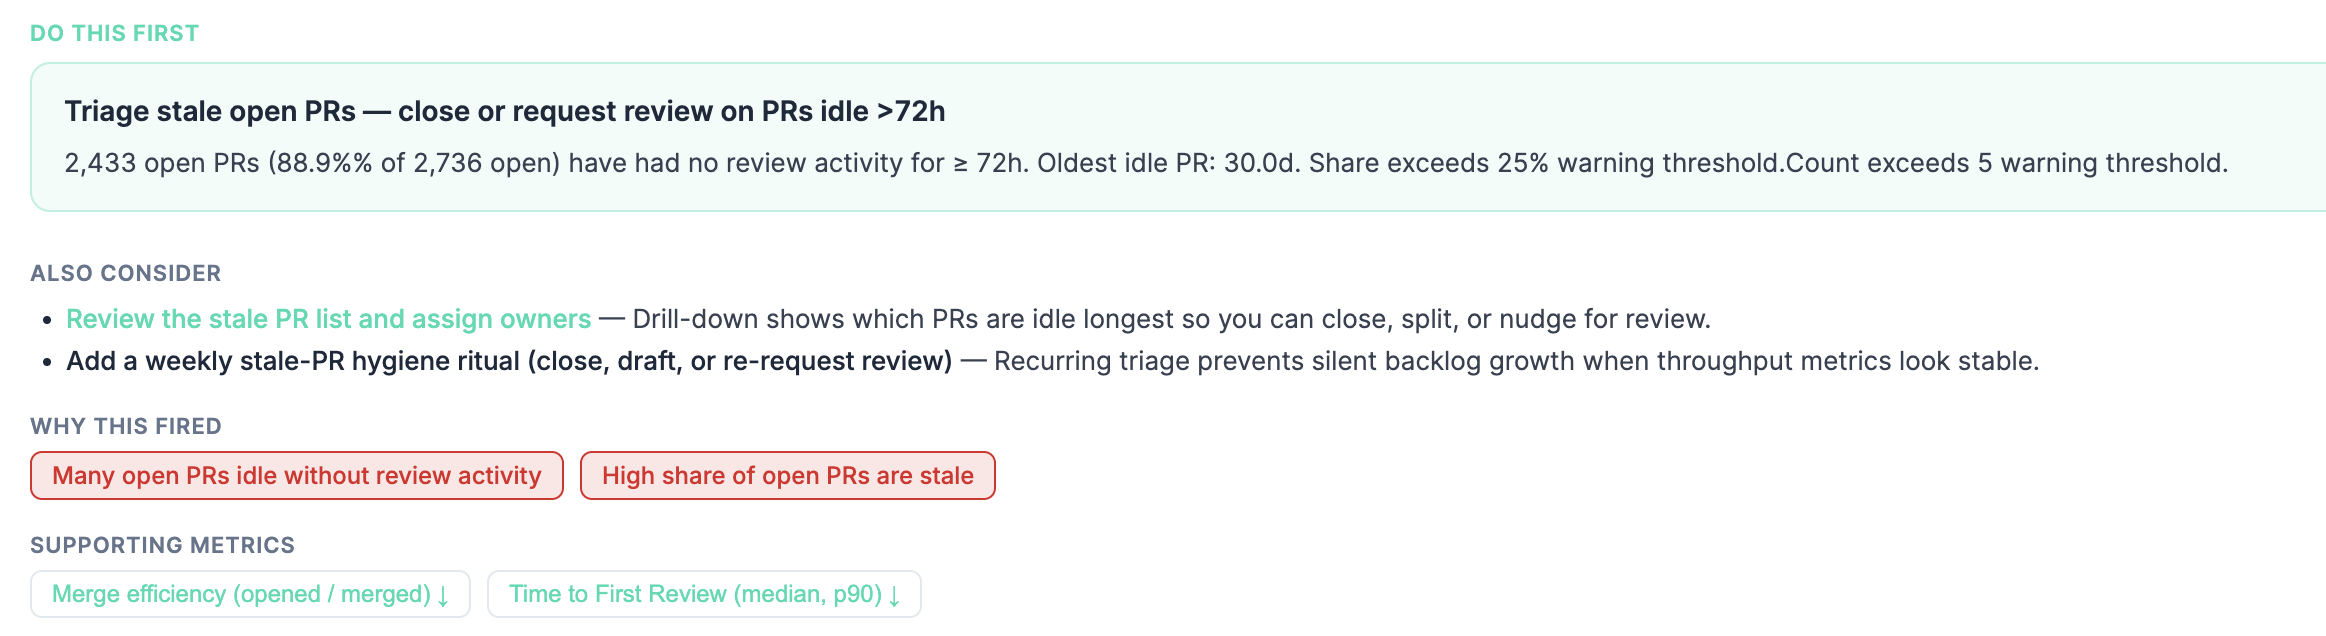
Every triggered signal includes a Do this first recommendation — one primary action with evidence-aware rationale tied to your org's numbers.
Set a 24h first-review SLA — median first review is 14h vs 8h target.
Secondary actions appear under Also consider. They are ranked and contextual, not a flat list of generic advice.
3. Investigate
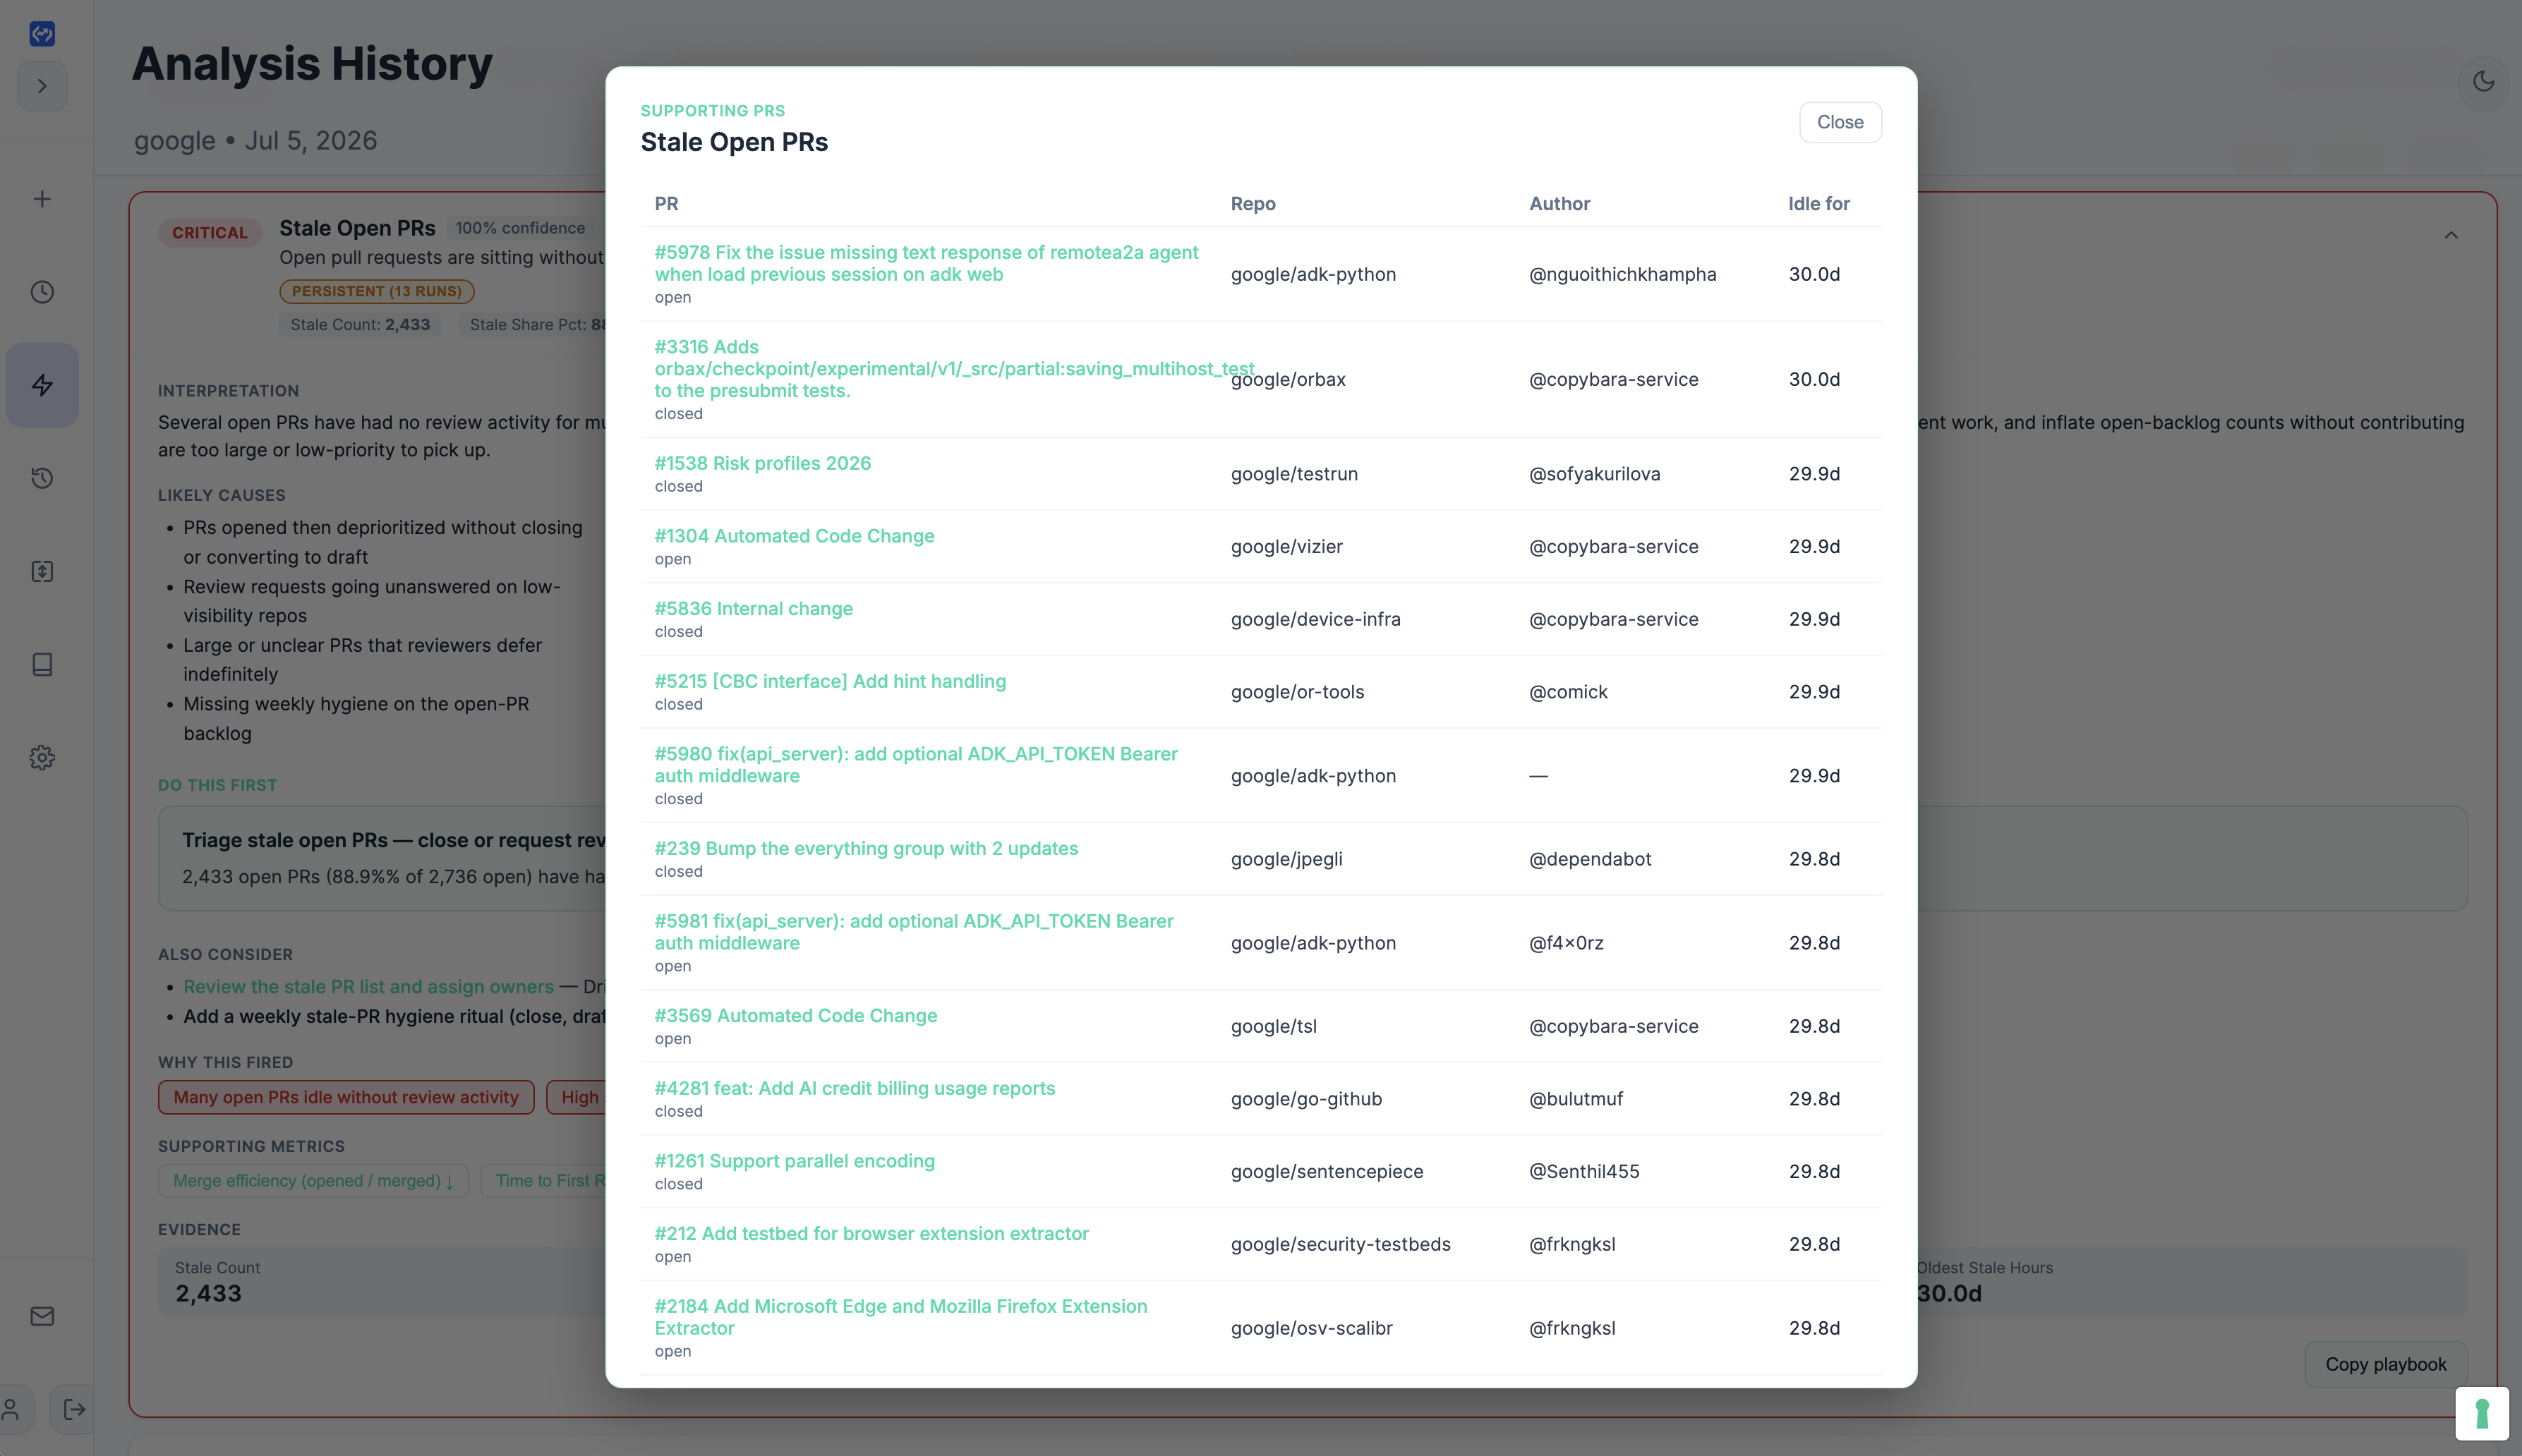
Click the primary action's investigate button and GitQuick opens a drill-down panel with the PRs or reviewers behind the signal — longest-waiting PRs, stale open PRs, top reviewers by share. Each row links to GitHub.
You can also jump to supporting metrics on the Metrics tab, or Copy playbook to export the signal summary, actions, and top PR links as markdown for Slack or standup.
4. Track
Signals reflect a single run. But problems that persist across runs deserve more attention than one-off spikes.
After your second completed run, GitQuick compares signal snapshots and tags each card:
- New — first time this signal fired
- Worsening — severity increased since the previous run
- Persistent (N runs) — fired in N consecutive runs
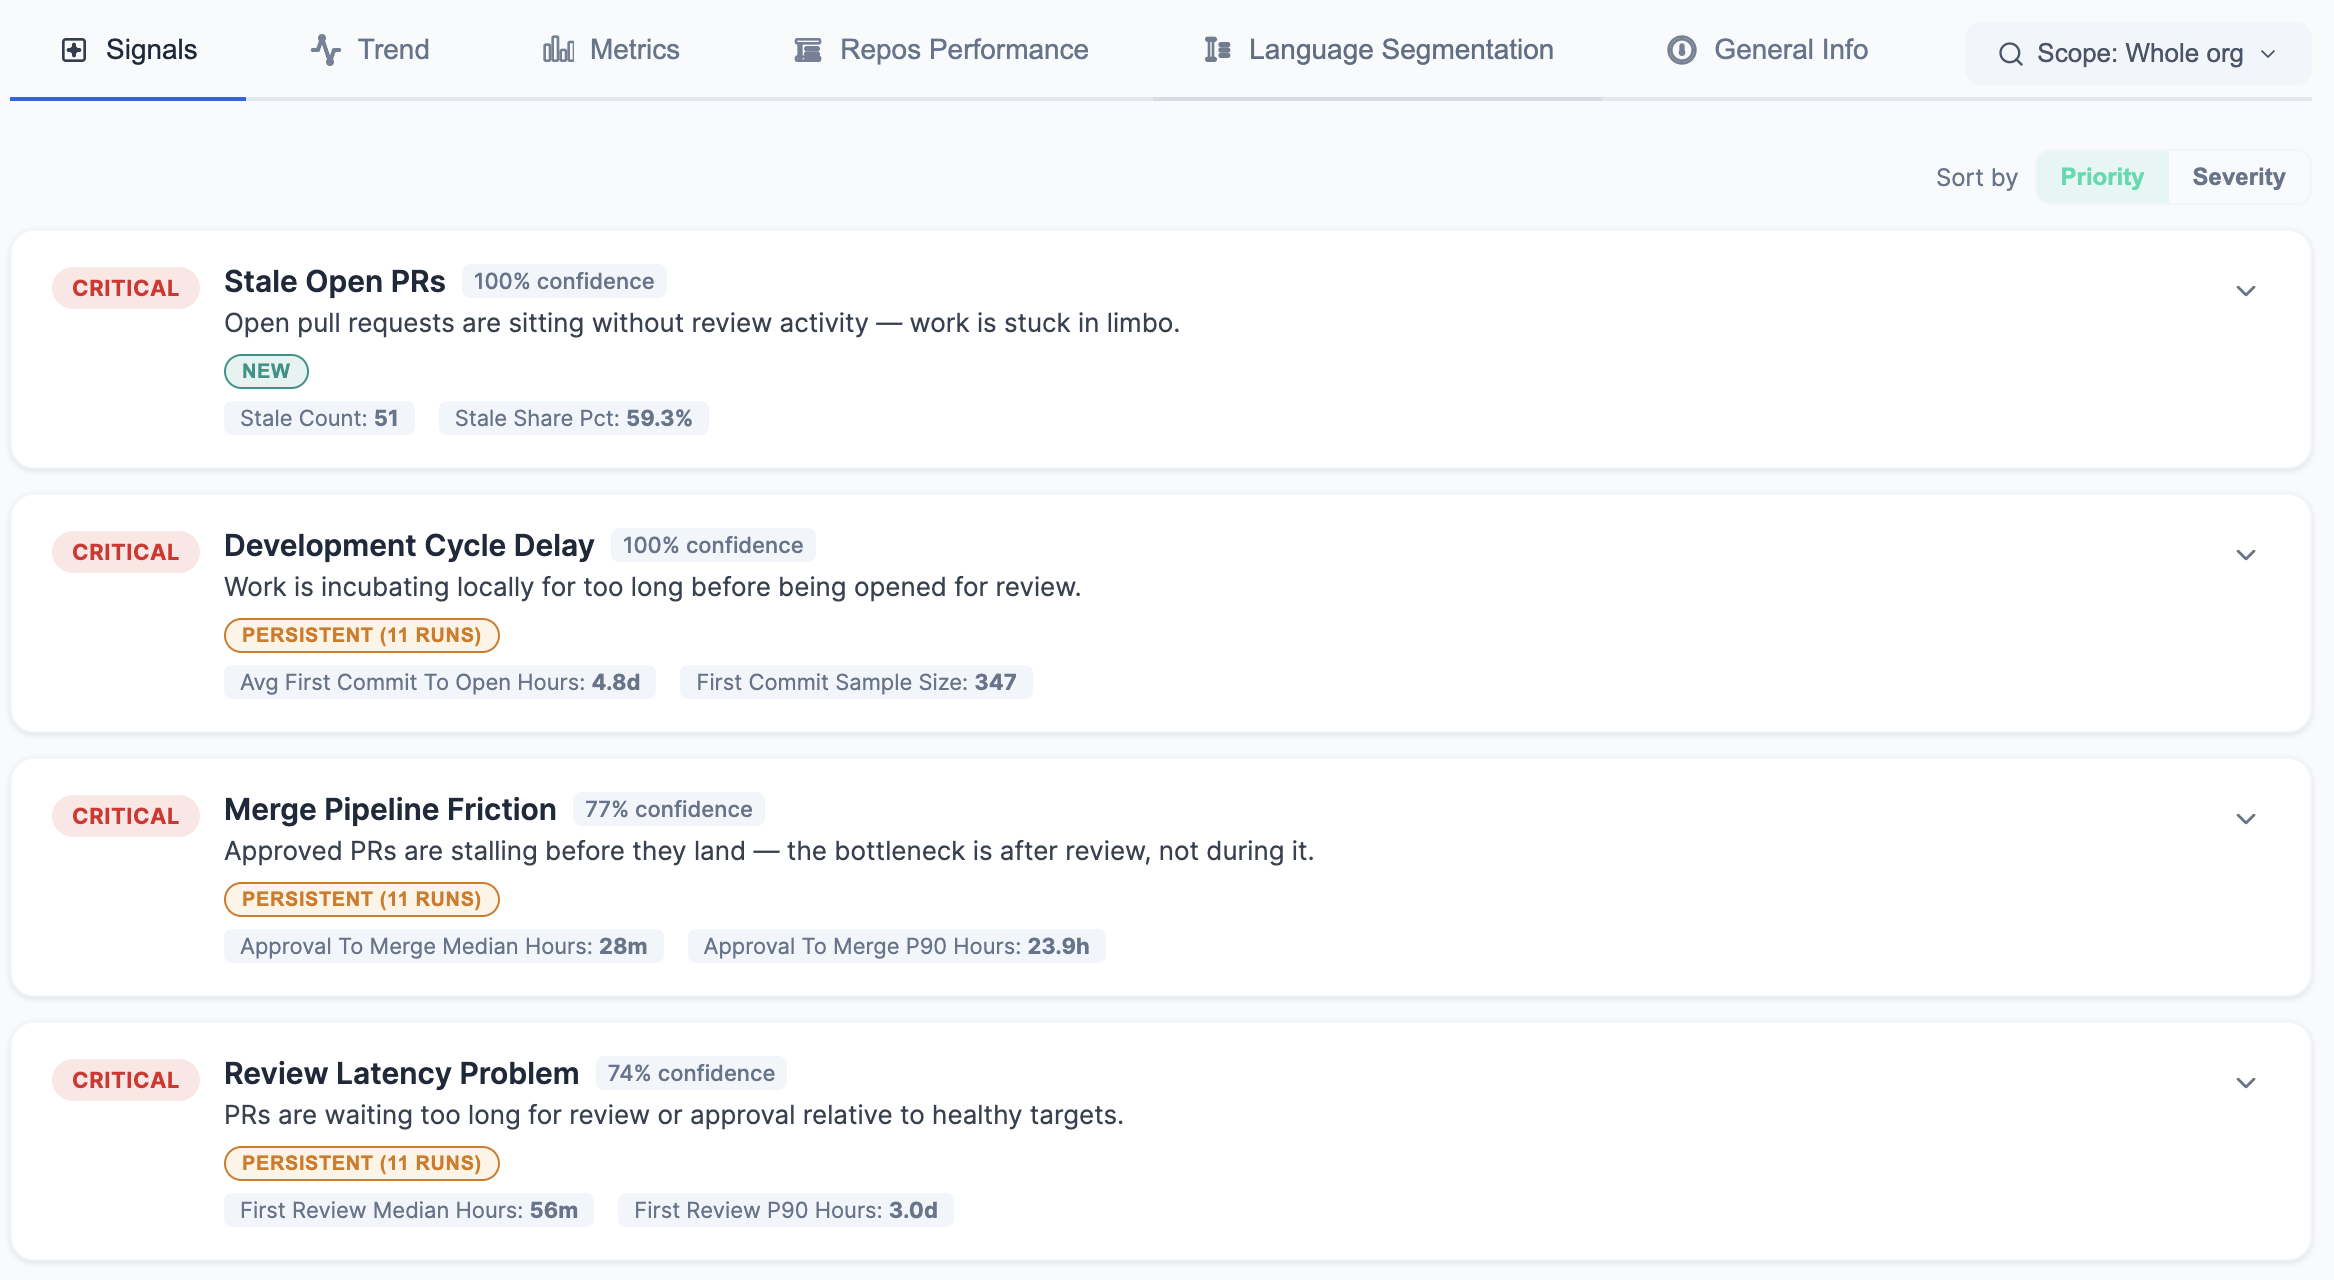
Sort by Priority (default) to surface worsening and persistent signals first. When everything clears, you will see an all-resolved banner.
Cross-run badges need at least two completed runs. That is one reason to schedule weekly org runs — not just to refresh data, but to separate noise from drift.
Walkthrough: Review Latency Problem
Suppose GitQuick flags Review Latency Problem at High severity.
The evidence might show:
- Median time to first review: 14 hours (threshold: 8h)
- Median time to approval: 36 hours (threshold: 24h)
- P90-to-median tail ratio: 4.2× (threshold: 3.0×)
The card interprets this: most PRs wait half a day before anyone looks, and a subset sits much longer than the median suggests.
Do this first: Set a 24h first-review SLA and route PRs to available reviewers — median first review is 14h vs 8h target.
Click Investigate and the drill-down lists the PRs with the longest wait times. Copy the playbook, paste it into your team channel, and you have a concrete starting list — not a vague "reviews feel slow."
If the same signal shows Persistent (3 runs) next week, you know this is not a holiday-week anomaly. Escalate.
The eight checks
GitQuick evaluates exactly eight signals on every org run. Only triggered signals appear — no news is good news.
1. Review Latency Problem
Pull requests are waiting too long for first review or approval. Catches both elevated medians and long-tail spikes where P90 is many times the median.
Related reading: Pull request review latency · Why teams underestimate review speed
2. Merge Pipeline Friction
PRs are approved but not merging quickly. The bottleneck is after review — merge queues, CI, release gates — not during it. Flags elevated medians, long approval-to-merge tails, and cases where post-approval wait dominates the cycle.
Related reading: Your PRs Are Approved. Why Aren't They Merging?
3. Backlog / Throughput Imbalance
More PRs opened per week than merged. Individual cycle times can look fine while the queue silently grows. Merge efficiency above 1.2 means intake exceeds output.
4. Review Quality Risk
Human review may be bypassed or diluted. Combines merged-without-review rate and bot review share. A high bot percentage alone is not bad — but paired with rising zero-review merges, the safety net is weaker than activity counts suggest.
Related reading: Half Your Merges Might Have Zero Review
5. PR Size / Complexity Risk
Pull requests are too large for effective human review. Median above 400 lines or P90 above 1,000 lines triggers warnings. Research suggests reviewers struggle to give thorough feedback above 200–400 changed lines.
6. Development Cycle Delay
Engineers are keeping work on local branches too long before opening a PR. Long incubation correlates with oversized diffs and delayed feedback.
7. Reviewer Concentration
Review work is concentrated in a small number of reviewers. Top-2 share above 50% means half of all reviews go through two people — a bus-factor bottleneck even when headline latency looks fine.
8. Stale Open PRs
Open pull requests sitting without review activity for 72+ hours. Stale PRs decay in value, inflate the backlog, and block dependent work without contributing to throughput. Deep dive: GitHub Capped Open Pull Requests. The Stale Queue Is Still Invisible.
What the showcase data suggests — and what it cannot show
GitQuick's public Showcase lets you inspect headline metrics for major open-source orgs without signing in. The spread is instructive.
| Org | Median merge | Merged w/o review | Median PR size |
|---|---|---|---|
| Microsoft | 3.9h | 8.9% | 70 |
| 11.7h | 45.4% | 56 | |
| Anthropic | 3.2h | 0.1% | 16 |
| Netflix | 3.4h | 52.4% | 43 |
Microsoft would likely pass Review Quality Risk (low zero-review rate) but might trigger Reviewer Concentration given how review load clusters. Google would almost certainly fire Review Quality Risk at Critical. Anthropic's small PR sizes and tight review trail would probably show fewer triggered signals overall.
Those are inferences from public metrics. The Signals tab itself runs on authenticated org runs only — you need to connect your GitHub org to see the full playbook with actions, drill-downs, and cross-run badges. Showcase calibrates your intuition; your org run tells you what to do Monday morning.
Scope when the org average lies
A signal visible at org level may disappear when you zoom into one repo — or the opposite. Use the scope selector to view signals for the whole org, a single repository, or a custom repo group.
Org-wide latency can look healthy while one monorepo drives Review Latency Problem every week. Scoped signals recalculate for the selected scope so you can route the right fix to the right team.
What "all clear" looks like
If nothing is wrong, the Signals tab shows:
✓ No signals detected in this run — all headline metrics are within healthy thresholds.
That is a good outcome. It means none of the eight checks found a pattern above its warning threshold — not that your process is perfect, but that nothing in the data crossed a threshold worth acting on this week.
When previously triggered signals resolve, GitQuick shows a banner noting what cleared since the last run. Progress becomes visible, not just problems.
Try it on your org
Dashboards show numbers. Signals turn those numbers into a weekly playbook: what is wrong, how serious, what to do first, which PRs to look at, and whether the problem is new or recurring.
Most teams have never had that layer. They have charts, Slack threads, and gut feel.
Run GitQuick on your GitHub org, complete two runs, and open the Signals tab. Sort by Priority. Expand the top card. Copy the playbook.
Signals are derived from GitHub pull request metadata only. They reflect review-process patterns, not code quality or internal engineering culture. Thresholds and rules are documented in the Signals Guide. GitQuick is not affiliated with or endorsed by the organizations featured in the Showcase.