Pull Request Review Latency: How to Measure It and Find Bottlenecks
Define pull request review latency by stage — time to first review, approval, and approval-to-merge — and use median vs P90 to find where the process actually stalls.
By Ahmad Hajjar
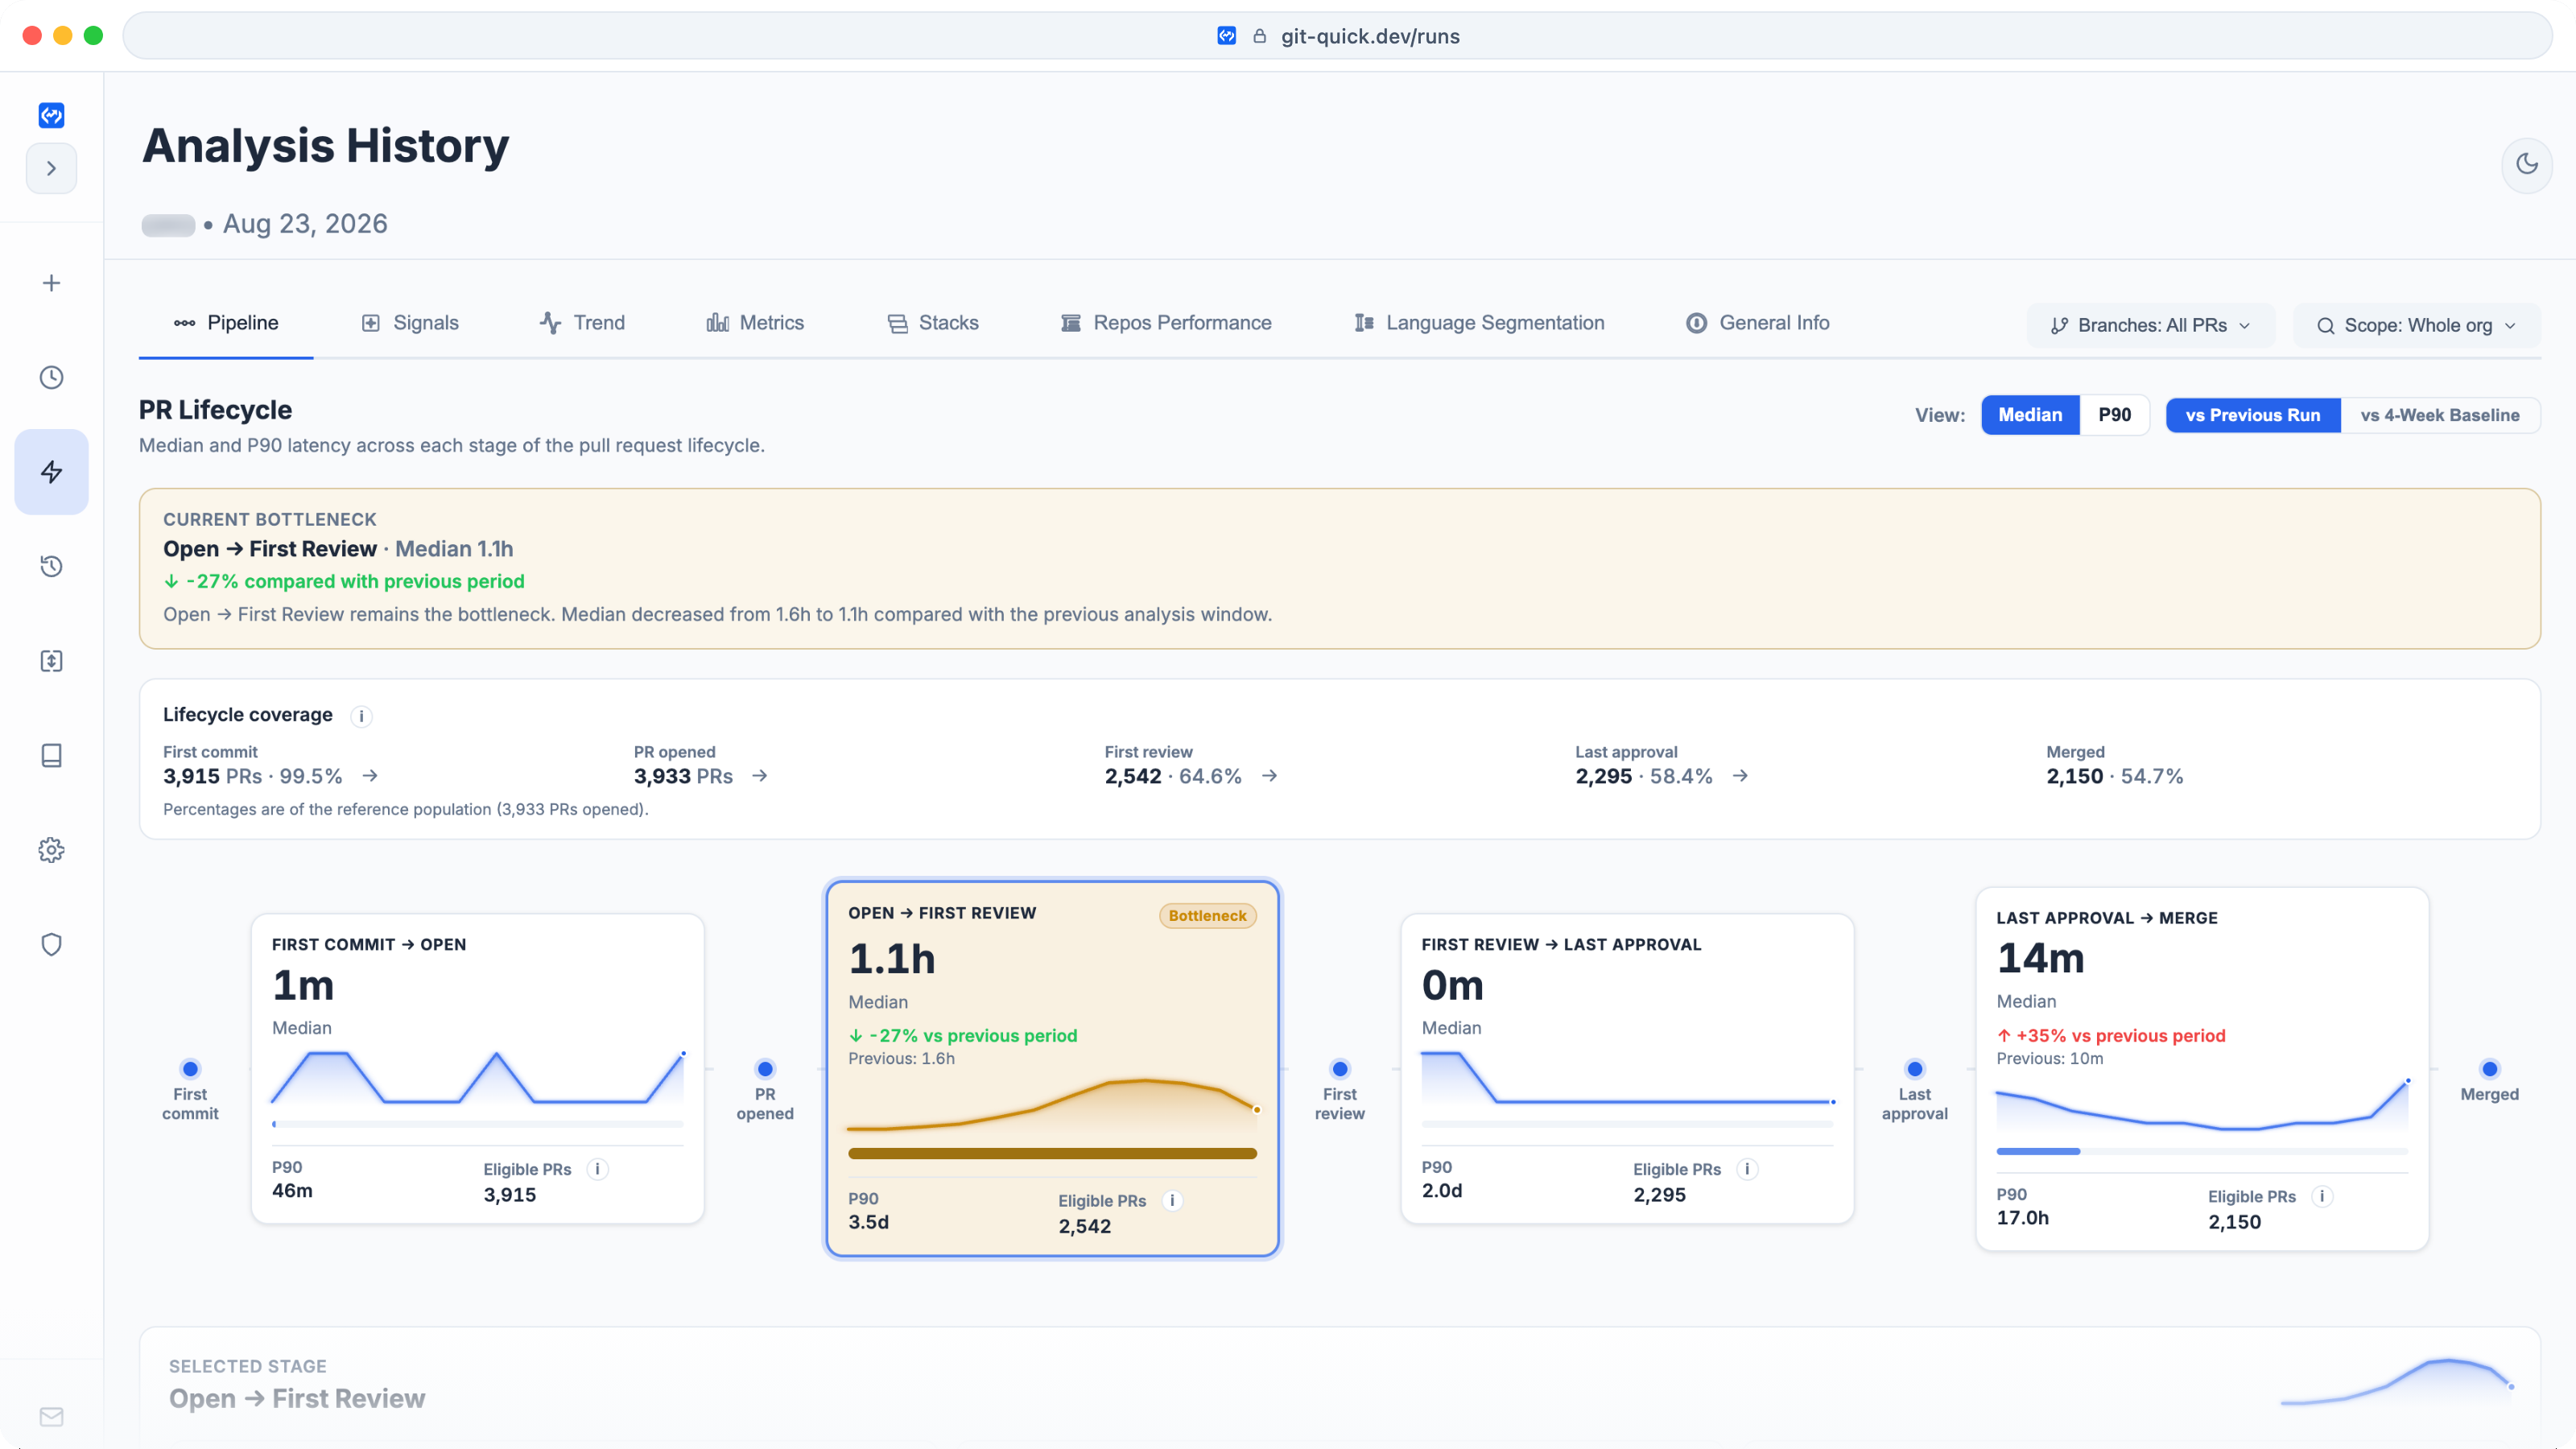
Pull request review latency is how long a change waits in the review process before it can move forward. It is not one number. It is a set of stage durations computed from GitHub pull-request metadata — open, first review, approval, merge — that together show where the process slows down.
Engineering managers, platform teams, and senior engineers usually feel latency before they measure it. A PR that “felt same-day” can still sit untouched overnight. A healthy median can hide a long P90. Without stage-level metrics, teams argue about anecdotes instead of bottlenecks.
This guide defines pull request review latency, explains the stages worth separating, and shows how GitQuick exposes those PR review metrics from GitHub metadata.
What pull request review latency means
In practice, pull request review latency is wall-clock time spent waiting on review-related events after a PR is opened. Useful definitions always answer: waiting for what?
Common stages:
| Stage | Question it answers |
|---|---|
| Time to first review | How long until anyone reviews at all? |
| Time between review events | How long do re-review loops take? |
| Time to approval | How long until the PR is approved? |
| Approval-to-merge time | How long after approval until the code lands? |
GitQuick computes these from timestamps on pull requests and reviews. It does not read source code or file diffs — only metadata such as created time, review times, approval times, and merge time.
Time to first review
Time to first review is the wait from PR open until the first recorded review (human or bot).
It is often the most visible developer frustration metric: an untouched PR feels like being ignored, even when later stages are fast.
GitQuick reports median and P90 hours for time to first review, plus a simple spread of PRs at or below the median, between median and P90, and above P90. That distribution matters more than a single average.
If first-review waits are high while approval-to-merge is short, the bottleneck is reviewer capacity or routing — not CI or merge gates.
Read that duration alongside its eligible sample: check review coverage before trusting the headline review time. PRs without a qualifying first-review event do not contribute a completed first-review duration.
Time between review events
Many PRs are not “one review and done.” Reviewers request changes, authors push updates, and reviews resume. The gap between review events — and the number of review rounds — shows whether latency is a slow first look or a long back-and-forth loop.
Large or unclear PRs often inflate this middle segment. So does thin reviewer coverage in a specialist area of the codebase. Measuring rounds and re-review rate keeps you from blaming “slow reviewers” when the real issue is PR shape or ownership.
Approval-to-merge time
Approval-to-merge time is the wait from the last approval to the actual merge. It deliberately separates “waiting to merge” from review latency.
When this segment is elevated, the fix is rarely “hire more reviewers.” It is usually merge queues, flaky CI, release gates, or missing auto-merge for low-risk changes. GitQuick isolates this as its own metric and as the Merge Pipeline Friction signal.
If you only track “time to merge” from open to land, you cannot tell whether the delay was review or post-approval pipeline.
Median versus P90 latency
Report median (P50) and P90 for every latency stage.
- Median describes the typical PR.
- P90 describes the long-tail experience — the PRs that wait much longer than the middle of the pack.
A useful companion number is the P90 / median ratio. When the ratio is large, a minority of PRs dominate pain even if the median looks fine. GitQuick’s Review Latency signal checks both elevated medians and long-tail spikes where P90 is many times the median.
Why averages hide long-tail delays
Averages (means) pull toward outliers and still understate operational pain when most work is fine and a minority is terrible — or the reverse. Teams that quote only “average review time” often miss:
- Weekend and off-hours opens that look like “next morning” in memory but add calendar days
- A small set of repos or authors that account for most extreme waits
- Bot-first reviews that improve “first response” while human approval still lags
Prefer median + P90 (and, when needed, the extreme tail) over a single mean. Sort PRs by wait descending when you investigate: the worst 10% usually teach more than the center of the distribution.
For the perception gap — why teams think reviews are faster than the data shows — see Your Code Reviews Are Slower Than You Think.
What review latency looks like in real GitHub organizations
The table below is from GitQuick public showcases, not a survey and not an industry benchmark. Each row is one public GitHub organization, one ~30-day org-run window ending between 20 and 26 August 2026, and the PRs included in that run.
How to read it. These organizations differ in size, bot usage, and what they merge. The point is diagnostic shape: median vs P90, and coverage vs speed. It is not a ranking.
Method notes
- Time to first review includes bot reviews. A 9-minute median can be automation, not human pickup.
- Medians and P90s are discrete percentiles over that stage’s eligible sample. Stage samples are not the same set of PRs.
- Opened and merged counts are different cohorts. Do not subtract them.
- Organizations with first-review sample size under 500 are omitted here so the tail is not dominated by a handful of PRs. Smaller windows still appear in the showcase.
| Organization | Median first review | P90 first review | First-review sample | Median merge | P90 merge | Merged without review | Bot review share |
|---|---|---|---|---|---|---|---|
| Microsoft | 1.0h | 1.3d | 32,678 | 2.7h | 4.5d | 8.2% | 41.4% |
| Vercel | 56m | 2.4d | 2,879 | 4.1h | 3.8d | 12.6% | 1.7% |
| AWS | 1.3h | 3.8d | 2,854 | 11.2h | 6.2d | 10.4% | 18.8% |
| Google Cloud | 9m | 3.6d | 2,842 | 3.2h | 6.5d | 22.4% | 26.4% |
| Anthropic | 2.5h | 20.7h | 2,310 | 3.2h | 21.5h | 0.0% | 2.3% |
| OpenAI | 10m | 12.1h | 2,044 | 16m | 19.9h | 49.2% | 42.0% |
| Rust | 4.8h | 4.0d | 1,662 | 14.7h | 5.8d | 38.6% | 0.3% |
| Adobe | 18m | 2.6d | 1,192 | 6.0h | 5.0d | 21.7% | 12.6% |
| Kubernetes | 9.2h | 5.1d | 979 | 10.5h | 7.5d | 35.5% | 3.6% |
| Apple | 4.0h | 3.6d | 604 | 19.7h | 6.9d | 6.7% | 0.0% |
What the values mean — without calling anyone “good” or “bad.”
Google Cloud’s median first review is 9 minutes, but P90 is 3.6 days. The typical PR is picked up quickly; a long tail is not. That is exactly why median-only reporting fails.
OpenAI’s first-review and merge medians are short, and merged-without-review is 49%. Speed and coverage are different questions. You cannot infer one from the other.
Apple’s bot share is 0% and median first review is 4.0 hours. Microsoft’s median is 1.0 hour with 41% bot reviews. Those are not comparable “review cultures” until you separate automation from human pickup.
Anthropic’s merged-without-review rate is 0% in this window, with a 2.5-hour median first review and a relatively tight P90. That describes a coverage-heavy path in this sample. It does not prescribe a policy for a 200-person product org.
Vercel’s bot share is low (1.7%) while P90 first review is still 2.4 days. Fast automation is not the only way a median looks healthy.
Windows roll as showcase runs refresh. Treat the table as a snapshot of method, not a permanent scoreboard.
See how these metrics look in real public GitHub organizations: the showcase gallery and the org pages linked above.
How reviewer load and PR size influence latency
Latency is an outcome. Two common drivers show up in the same GitHub metadata:
Reviewer load. If a small share of people (or automation accounts) perform most reviews, first-review and approval waits rise when those accounts are unavailable. Concentration is invisible in a healthy-looking median until you look at reviewer share.
PR size. Larger diffs take longer to start and longer to finish. Size risk and review latency often move together: oversized PRs sit longer and attract more rounds. Measuring additions/deletions alongside latency stages avoids treating capacity and PR hygiene as the same problem.
Neither relationship is universal for every org. The point of measurement is to see which driver dominates your window — not to assume a fixed industry formula.
How GitQuick exposes these metrics
GitHub PR analytics in GitQuick turn org-wide pull request metadata into stage-level latency and related process metrics:
- Time to first review (median, P90, spread)
- Time to approval
- Approval-to-merge time
- Time to merge (open → merge)
- PR throughput (opened/merged per week)
- Reviewer workload and concentration
- PR size
- Merged without review
- Bot versus human review activity
On top of the metrics, the Review Latency Problem signal flags runs where first-review or approval waits look unhealthy — including long-tail cases — with severity, evidence, and a path into the underlying PRs. The broader Signals playbook places latency next to merge friction, backlog growth, and quality risk so you fix the stage that is actually stuck.
What to look at first
- Time to first review median and P90 — is the queue starting late?
- Approval latency and review rounds — is the loop long after the first look?
- Approval-to-merge — is review fine but landing slow?
- Reviewer load and PR size — which input explains the waits?
You do not need a benchmark table to start. You need stage separation, median versus P90, and a weekly habit of reading the same metrics on the same window.
See how these metrics look in real public GitHub organizations, then run the same views on your own org.