Did Your Code Review Process Actually Improve?
Learn how to measure code review improvement with comparable PR metrics, rolling-window baselines, and GitQuick's Trend and Compare Analysis views.
By Ahmad Hajjar
You introduce a reviewer rotation. A few analyses later, time to first review is lower. The change appears to have worked.
Before keeping the policy or rolling it out to more teams, check whether the wait improved where you expected, whether it stayed lower, and what else changed. A faster headline metric is a useful observation. Evaluating a code review process change takes a comparison you can explain.
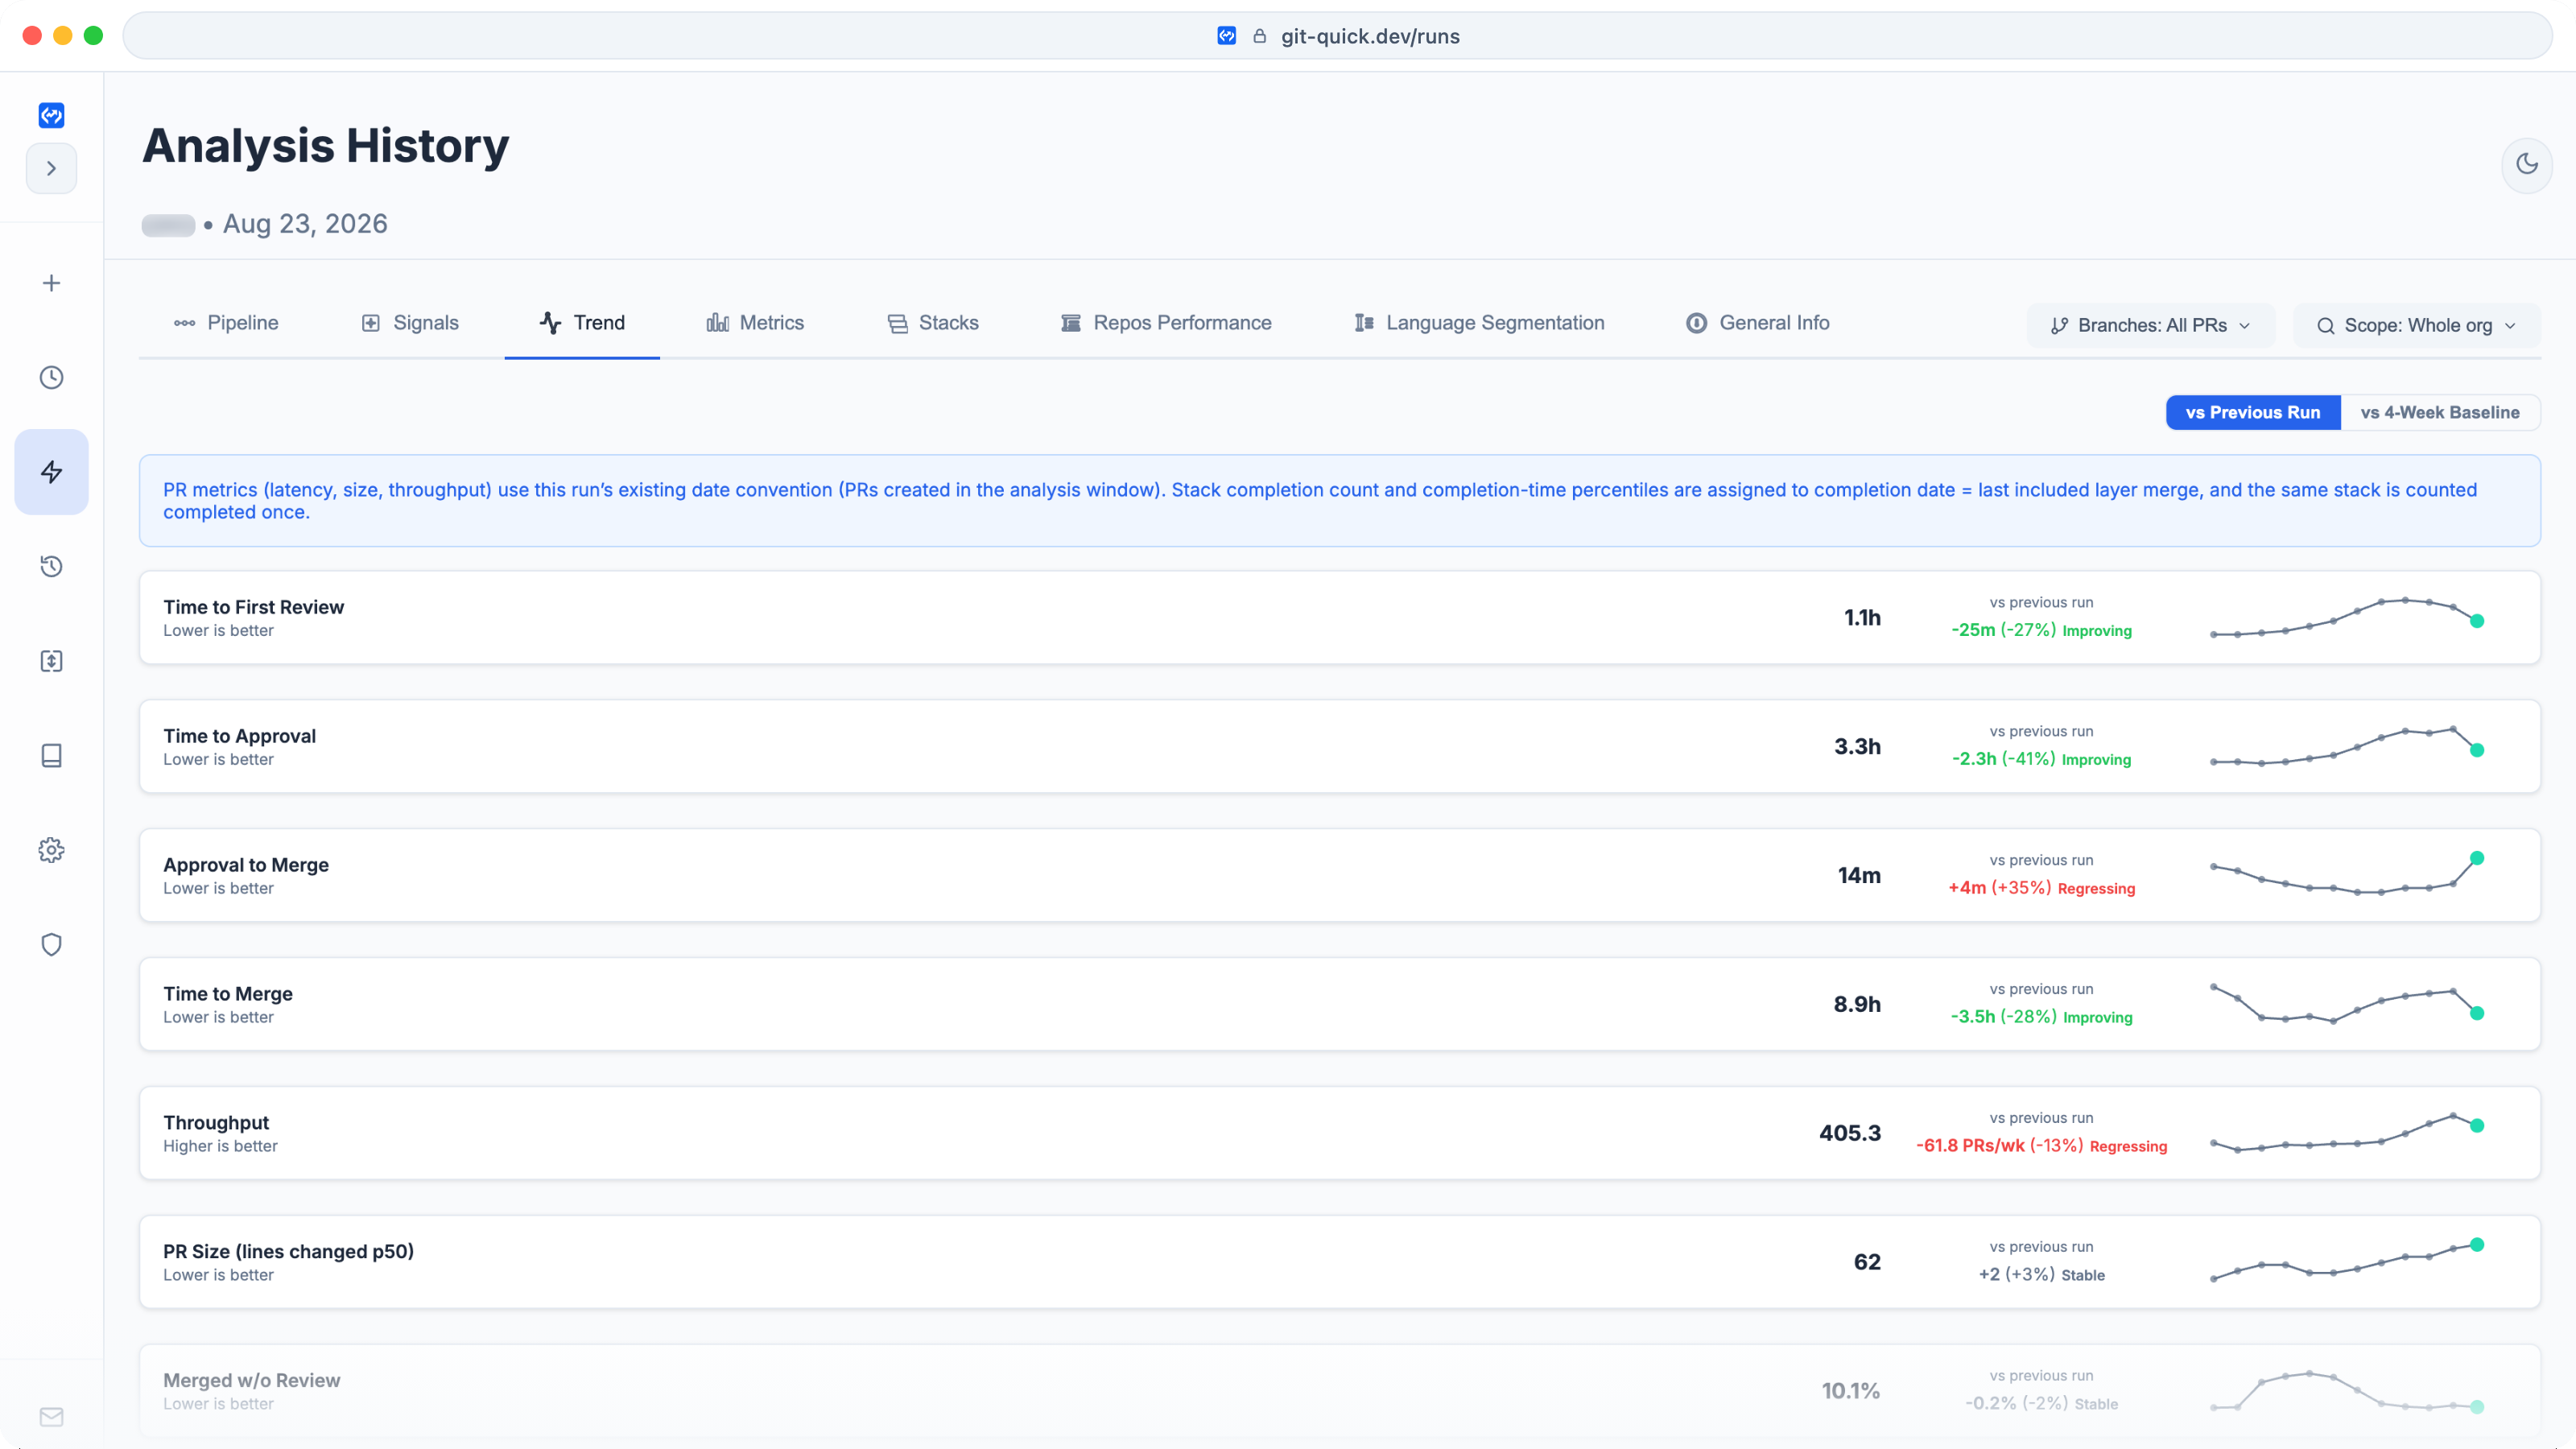
Historical product screenshot from 23 August 2026. It illustrates the Trend interface, not current showcase performance or evidence that a particular intervention worked.
Define the improvement before making the change
Write down the problem, the action, and the expected result before looking at the next dashboard.
For a reviewer rotation, that might be: “Feature PRs in the payments repositories wait too long for a first review. We will assign a daily reviewer and check whether typical and long-tail waits fall.”
That is more useful than “improve cycle time.” It identifies the affected work and the stage the action should change.
| Change | Primary measure | Check alongside it |
|---|---|---|
| Assign a daily reviewer | Time to first review, median and P90 | Reviewer distribution and PRs still waiting |
| Split large changes | PR size and time to approval | Review rounds and completion of dependent PRs |
| Change merge-queue or CI policy | Approval-to-merge time | Failed checks, queue removals, and release outcomes |
P90 is the value at the 90th percentile of the eligible duration sample. Read it alongside the median so a better typical wait does not hide a worse experience in the tail.
The last row also needs evidence from CI and release systems. PR timestamps alone cannot tell you whether checks became more reliable.
Google’s review guidance distinguishes prompt responses from completing the whole review. The same distinction helps you choose a measure: a routing change should first affect pickup, while a queue change should affect the wait after approval.
Keep the baseline comparable
Use the same analysis-window length, repositories, and target-branch selection. Record the date the policy changed and note other events that could affect the result: holidays, a release freeze, staffing changes, or a new automated reviewer.
GitQuick analyzes PRs created in each run’s analysis window. A later run with the same window length still contains a different population. If most new PRs are small dependency updates, an organization-level improvement might say little about the feature work you intended to help.
Check the affected repositories before extending a local result to the whole organization. For workflows with release promotions or backports, check the target branches behind your PR metrics.
Also check how much of the window falls before the intervention. A run collected immediately after a policy change can still contain mostly older work. Recent PRs may not have reached review or merge yet, so their completed durations are absent. Read the eligible samples and outstanding work before treating a short latency as a result.
Understand what the trend compares
GitQuick’s Trend tab shows headline metrics across up to 12 completed analyses. Its toggle compares the selected run with the previous run or a four-week trailing baseline. Compare Analysis, available on Team and above, puts two completed runs side by side and includes repository comparisons when both runs belong to the same organization.
Those views answer related questions, but their baselines need interpretation.
Previous run: useful for spotting a recent change. It can also make an unusual earlier run look like the normal starting point.
Four-week baseline: summarizes the available earlier completed runs in the preceding 28 days and needs at least two prior runs. For each headline metric, GitQuick uses the median of those run-level values. It does not pool their PRs into one new four-week sample. Each run keeps its own analysis window.
If you repeat a one-month analysis a week later, the windows overlap substantially. Many of the same PRs can contribute to both runs. That helps monitor a rolling process, but two improving points are not two independent confirmations that the policy worked.
GitQuick warns when the baseline includes a different analysis-window length. Check repository and branch choices yourself as well; that warning does not audit every workflow change.
As post-change work enters the trailing baseline, the baseline also shifts. Keep the original pre-change run for reference, and keep a short note of the intervention outside the dashboard.
Treat “improving,” “stable,” and “regressing” as rule-based direction labels. They are not statistical significance tests or estimates of the policy’s causal effect.
Check the tradeoffs, then decide
A lower first-review median can accompany a higher P90, more merges without review, or unchanged approval waits. Adding an immediate bot review can also shorten time to first review while authors still wait for human attention.
Check the reviewer mix and review coverage alongside speed. Review counts do not measure review effort or quality, and account-based classification can misidentify automation.
Then inspect a few PRs from the affected repositories and ask authors and reviewers whether the intended problem improved. Repeated comparable observations, a plausible explanation, and the team’s experience provide a better basis for a decision than one percentage delta.
DORA’s improvement guidance follows a similar sequence: establish a baseline, address a constraint, check progress, and repeat. Applying that approach to PR review is useful, while delivery outcomes still need their own evidence. PR merge time does not measure deployment lead time or production stability.
End the review with a concrete decision: keep the change, adjust it, or gather more comparable observations. Record why. That turns the next analysis into a follow-up on an engineering decision.
Explore GitQuick’s public showcases, then track how your own code review process changes over time.
Disclaimer: The intervention examples are illustrative. The screenshot is historical, and its full analysis-window boundaries are not available here. GitQuick measures GitHub PR metadata; trend deltas do not establish causation, code quality, reviewer effort, or production delivery outcomes. Reviewer classification uses account login heuristics and can misclassify accounts. GitQuick is not affiliated with GitHub, Google, DORA, or AWS.