Your Code Review Metrics Are Missing Part of the Story
Fast PR reviews can hide unreviewed work. Learn how to read code review metrics using coverage, eligible samples, P90 latency, and GitQuick's AWS snapshot.
By Ahmad Hajjar
“Our typical pull request gets reviewed in about an hour.”
That sounds reassuring. But there is a question to ask before deciding your review process is healthy:
Which pull requests made it into that number?
Code review metrics describe different populations. Time to first review describes PRs with a recorded review. Time to merge describes PRs that merged. Neither number, on its own, tells you what happened to work that has not reached that event.
That distinction can change the decision you make in your next engineering meeting.
What code review metrics actually measure
A useful dashboard should help you answer three separate questions: how quickly work moves, how much work reaches each stage, and what is still waiting.
| Metric | What it tells you | What it leaves unanswered |
|---|---|---|
| Median time to first review | Typical elapsed time among eligible PRs with a first review | How long unreviewed PRs have already waited |
| P90 time to first review | The duration at or below which roughly 90% of the eligible sample falls | The wait for PRs without a recorded first review |
| Review coverage | How many PRs in a defined reference population have reached review | Whether those reviews were thorough |
| Merged without review | How often merged PRs lack the qualifying review event | Whether the changes caused defects |
| Open PR count and inactivity | How much work remains open and how much has gone quiet | Whether each quiet PR is blocked, deferred, or intentionally waiting |
These are complementary measurements. You need the population behind each one before combining them into a story.
An AWS snapshot: 1.1 hours, with 64.6% coverage
A historical GitQuick AWS analysis snapshot, dated 23 August 2026, shows the following in its Pipeline view:
| Pipeline measurement | Value |
|---|---|
| Reference population: PRs opened | 3,933 |
| Eligible PRs in the first-review sample | 2,542 |
| Displayed first-review coverage | 64.6% |
| Median open-to-first-review time | 1.1 hours |
| P90 open-to-first-review time | 3.5 days |
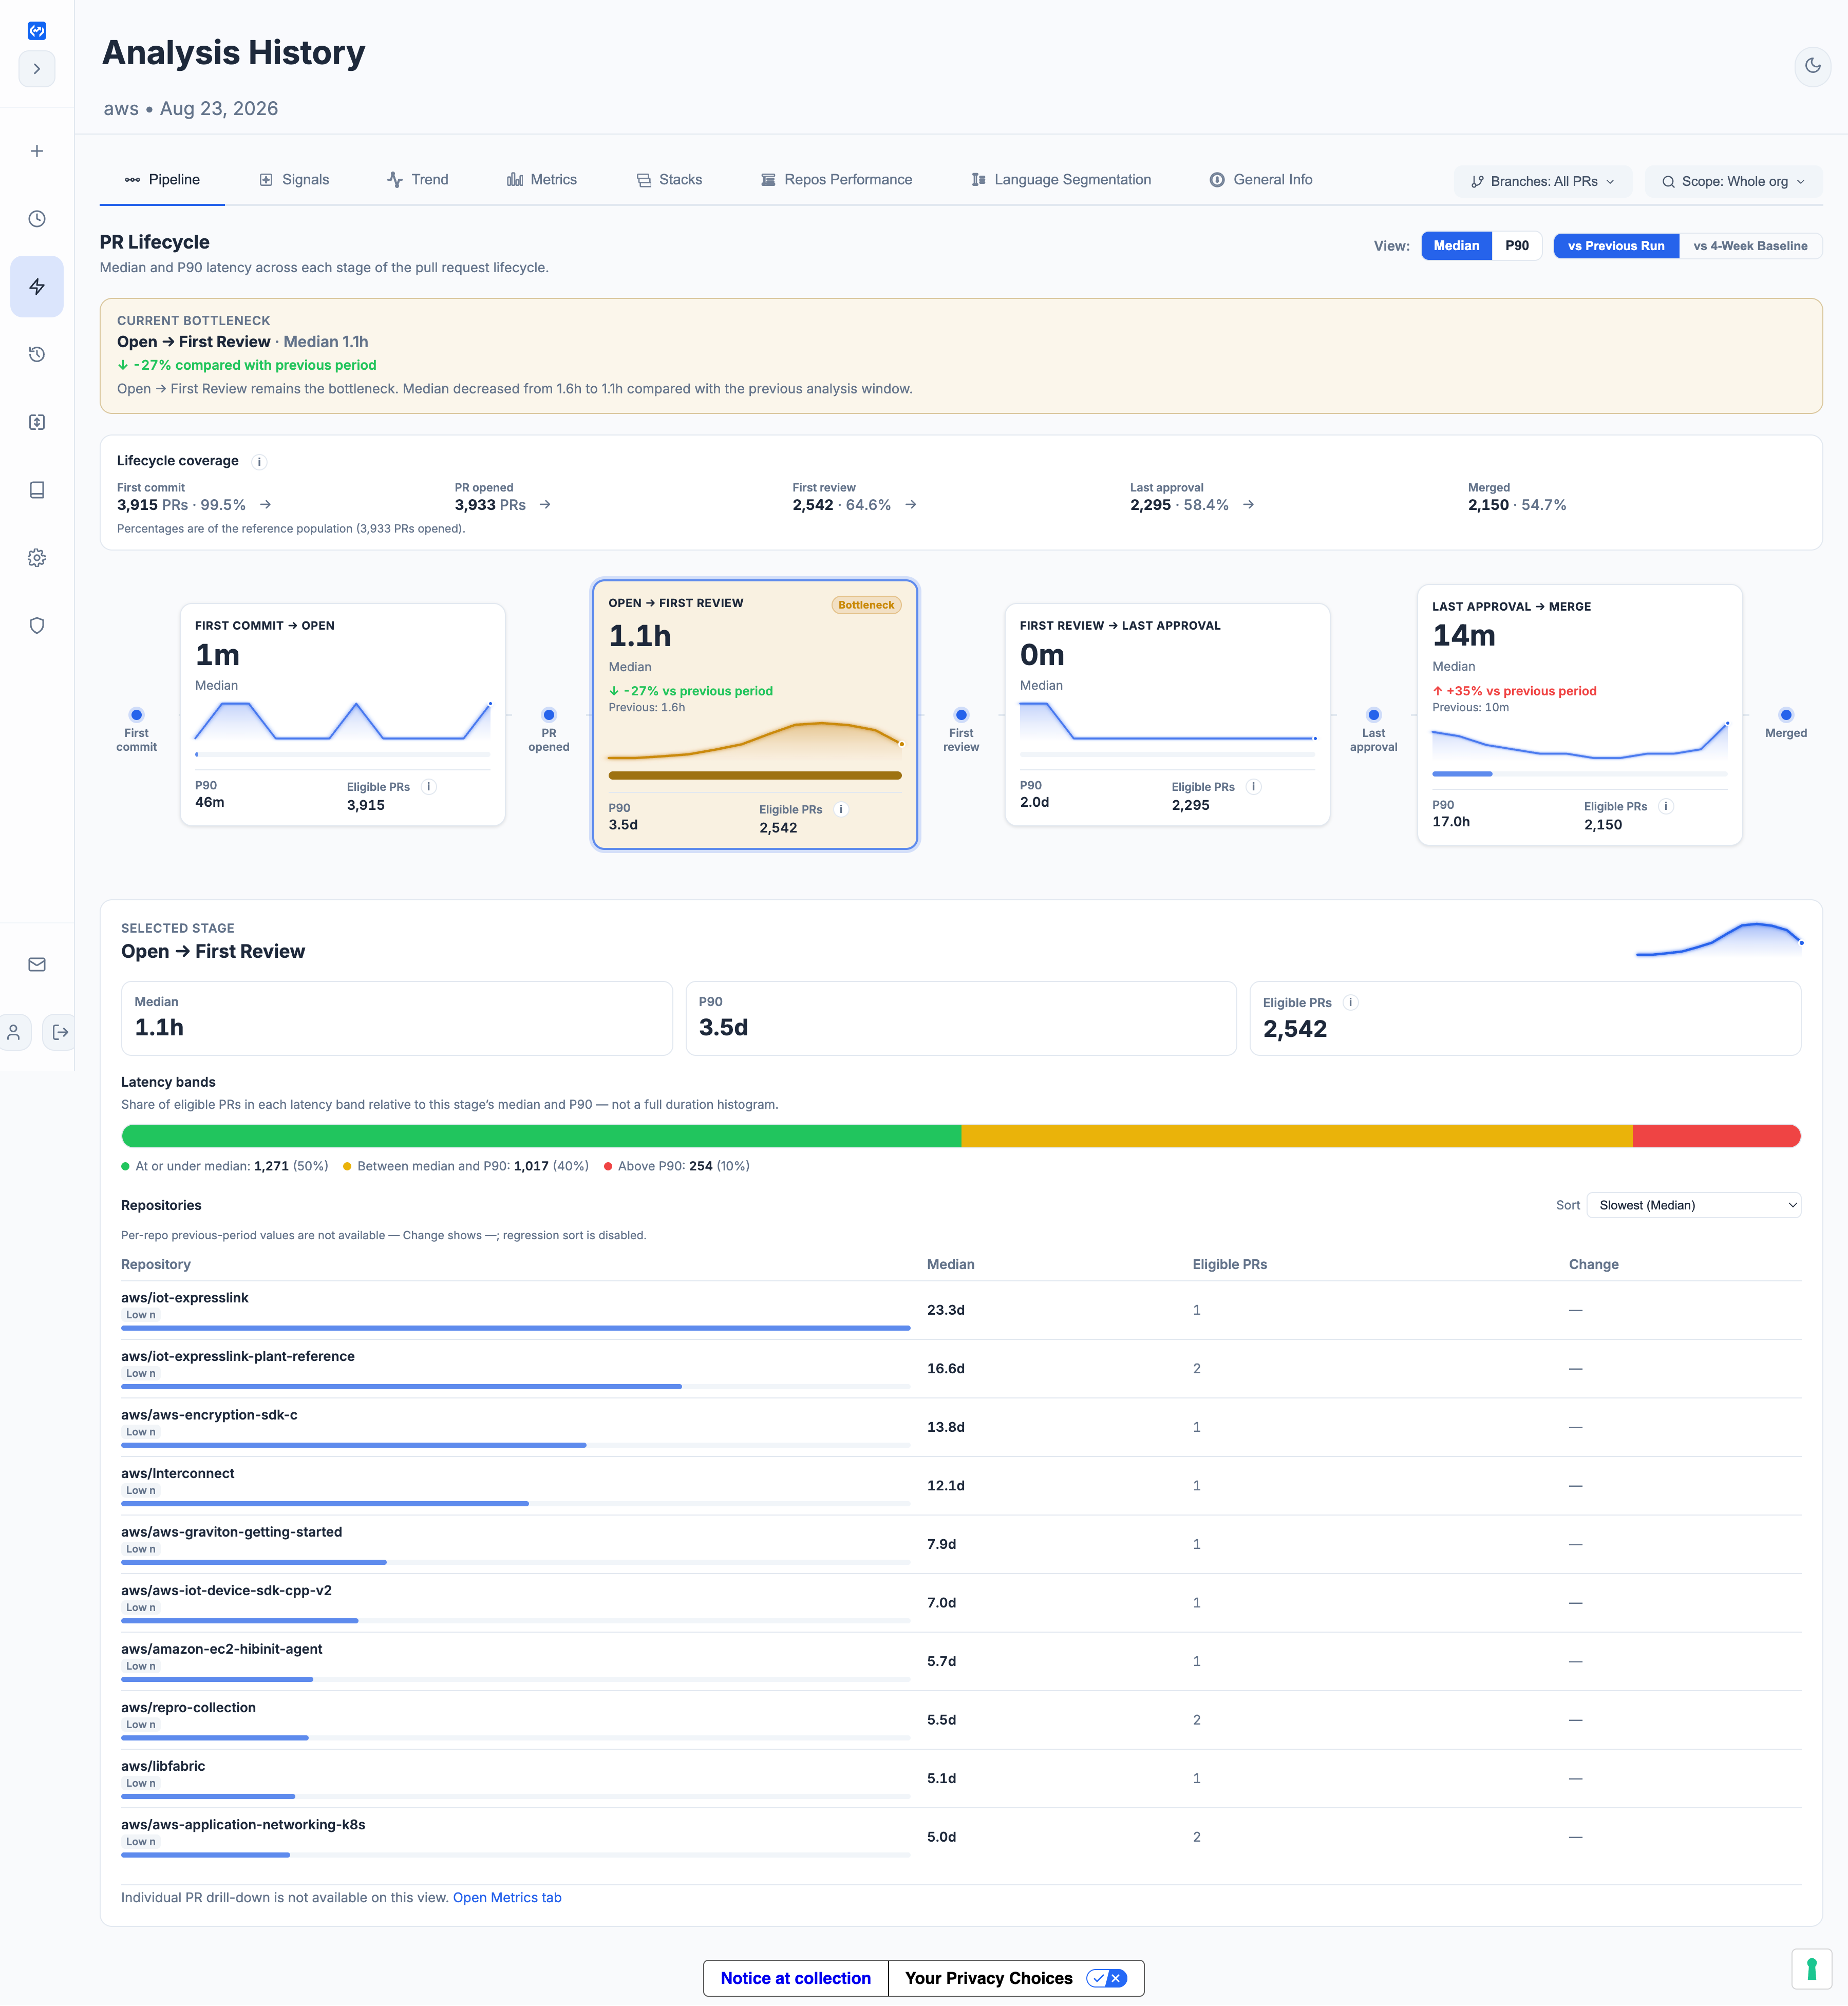
Historical AWS analysis snapshot dated 23 August 2026. Coverage uses the Pipeline reference count; durations use the stage's eligible PR sample.
The median tells us something useful: the middle of the measured first-review sample reached review in about an hour.
It does not mean half of all 3,933 PRs were reviewed within that time. The median belongs to the 2,542 eligible PRs with a recorded first review.
The first-review sample is smaller than the reference population by 1,391. The screenshot does not identify those individual PRs or explain every exclusion, so this difference should not be labeled an unreviewed backlog. Missing timestamps and eligibility rules can matter, as can recent arrivals, closed proposals, drafts, and work still waiting. Investigate the underlying PRs before drawing a conclusion.
The P90 adds another piece: even among PRs that reached review, the tail stretches to days.
Together, these numbers support a more precise statement:
In this historical snapshot, the eligible reviewed sample had a 1.1-hour median first review and a 3.5-day P90. The Pipeline view displayed a first-review eligible sample equal to 64.6% of its opened-PR reference count.
That is less convenient than “reviews take an hour.” It is also much more useful.
Why faster reviews can leave waiting work invisible
Imagine a team with 100 PRs. Twenty receive a review in an hour. Eighty are still waiting.
A completed-event calculation can report a one-hour median first review. That is correct for the twenty measured PRs. It would be misleading to present it as the experience of the entire queue.
This is a hypothetical example, not a GitQuick finding. It illustrates a practical reporting problem: unfinished waits have no first-review endpoint yet.
To detect that problem, read review latency alongside the open queue. Ask how old the unreviewed work is, whether recent arrivals explain the coverage gap, and whether the same repositories keep appearing in the waiting group.
Avoid one shortcut: assigning zero latency to PRs without a review. Missing an event does not mean the event happened instantly.
A review is also different from an approval
GitHub supports three submitted review decisions: comment, approve, and request changes. A comment review does not explicitly approve the change. GitHub's review documentation explains these distinctions.
Consequently, “reviewed,” “approved,” and “merged” should stay separate in your reporting. A low approval rate does not automatically mean nobody examined the work. A recorded review does not establish that the change received approval.
Automation adds another distinction. GitQuick's time-to-first-review definition includes recorded human or bot reviews. A fast bot review can shorten that measurement without establishing how soon a human looked at the PR.
This concern has empirical support: a study of 111,094 closed GitHub PRs found differences between bot and human first responses and recommended analyzing them separately. First response is broader than a submitted review, so its timings should not be treated as interchangeable with GitQuick's first-review timings.
Use bot-versus-human activity as context. Neither speed nor an approval count proves code quality.
Five checks before you report an improvement
Before announcing that code review is getting faster, check:
- The eligible sample. How many PRs contributed to the median and P90?
- The coverage. How much of the defined reference population reached that stage?
- The unfinished work. What remains open, unreviewed, or inactive?
- The review events. Are you measuring comments, submitted reviews, approvals, human activity, or automation?
- The comparison scope. Did the repositories, branch filters, analysis window, or mix of PRs change?
The last check matters because an organization-wide improvement can reflect a different mix of work. More small maintenance PRs in a fast repository can lower the overall median while a critical repository remains slow.
Use comparable scopes, then inspect repository-level results. When a repository has only one or two eligible PRs, treat its percentile as a prompt to inspect those cases, rather than a reliable ranking of team performance.
For the stage definitions, see our guide to pull request review latency. For intake and delivery pressure, read why fast reviews can coexist with a growing queue.
How to read this in GitQuick
Start with Pipeline. Read lifecycle coverage and the eligible PR count beside each stage's median and P90. Then use Metrics to examine review activity, bot-versus-human activity, merges without review, and open-work indicators.
Keep each view's denominator attached to its number. The historical snapshot's Pipeline and Metrics panels show different merged counts; those should not be combined into one funnel or used to calculate a new coverage percentage without reconciling their cohort definitions.
GitQuick analyzes GitHub PR metadata through a read-only GitHub App. It does not read source code or diffs. Its role here is to make the review process visible so you can choose what to investigate.
You do not need a universally “good” review time to start. You need to know whose experience your number describes, and whose it leaves out.
Explore the GitQuick public showcase, then check review coverage alongside speed on your own organization.
Disclaimer: Numerical examples use the historical AWS product screenshot dated 23 August 2026, not current AWS performance or an industry benchmark. The full analysis window boundaries are not available from the screenshot. The 100-PR example is hypothetical. Reviewer classification uses account login heuristics and can misclassify accounts. Review activity and latency do not establish code quality. GitQuick is not affiliated with or endorsed by GitHub, AWS, or the researchers cited.