More PRs Open Than Close? Your Review Queue Is Growing
Cycle time can look excellent while the queue keeps growing. Google Cloud's showcase window pairs a 17-minute typical first review and a 2.6-hour typical merging time with merge efficiency of 1.77 — and across seventeen public orgs, review latency and backlog growth barely correlate at all.
By Ahmad Hajjar
Your PRs can move quickly and your backlog can still grow.
That is what happens when a team optimises cycle time without paying attention to throughput. How fast does one PR move? and is the queue growing or shrinking? are different questions — and the metric almost everyone watches, time to first review, only answers the first one.
A worked example: fast reviews, growing queue
Google Cloud Platform's latest public showcase window on GitQuick:
- Typical time to first review: 17 minutes
- Typical merging time: 2.6 hours
- 1,064.2 PRs opened per week
- 600.6 PRs merged per week
- Merge efficiency: 1.77
By any cycle-time standard, the first two numbers are excellent. The next two say that roughly 460 more PRs arrive each week than leave. The same run counts 2,318 open PRs, 81.2% of them with no review activity for 72+ hours.
Nothing here is contradictory. A PR that gets looked at in 17 minutes and merged in under three hours is a well-run PR. It tells you nothing about how many PRs are waiting behind it. Fast individual PRs do not necessarily mean a fast delivery system.
The metric that catches it: merge efficiency
GitQuick tracks a deliberately simple ratio:
Merge efficiency =
avg_opened_per_week ÷ avg_merged_per_week
There are two thresholds worth keeping separate, because they answer different questions.
The arithmetic one is 1.0. Above it, you are opening more PRs each week than you are merging, and the difference has to go somewhere — it lands in the open-PR backlog. A team merging 100 PRs a week while opening 130 isn't "slightly behind." It is adding 30 PRs to the pile every week, and those PRs age, collect merge conflicts, and fragment reviewer attention while the median cycle time still looks perfectly healthy.
The product ones are 1.2 and 2.0. GitQuick's Backlog / Throughput Imbalance signal leaves a margin above the arithmetic line rather than alerting on every ratio over 1.0. It warns above 1.2 and escalates to critical above 2.0 — intake more than double throughput. Both are strict comparisons, so exactly 1.2 doesn't fire. A team at 1.1 is drifting slowly; a team at 1.4 gets told about it; a team at 2.2 has a capacity problem that a faster review SLA won't fix.
This is the throughput bottleneck that AI made worse. The CEPR/NBER study of 100,000+ GitHub developers found autonomous agents raised commit activity roughly 180% while releases rose only about 30%. More code gets written, so more PRs get opened. Review and merge capacity did not scale to match. Intake went up; output didn't. That gap is exactly what merge efficiency measures — we covered the broader version of this shift in The Bottleneck Moved. Your Metrics Probably Didn't.
The showcase data, with latency alongside
Here is merge efficiency across ten public organizations, using one-month GitQuick showcase windows (July 2026) — same pipeline, public GitHub metadata only. "Typical" is GitQuick's label for the median, and it's the same median you see on the org's Throughput card.
| Org | Opened / wk | Merged / wk | Merge efficiency | Typical first review | Typical merging time | Signal severity |
|---|---|---|---|---|---|---|
| React | 57.8 | 9.8 | 5.90 | ~1 min | 5.1 h | Critical |
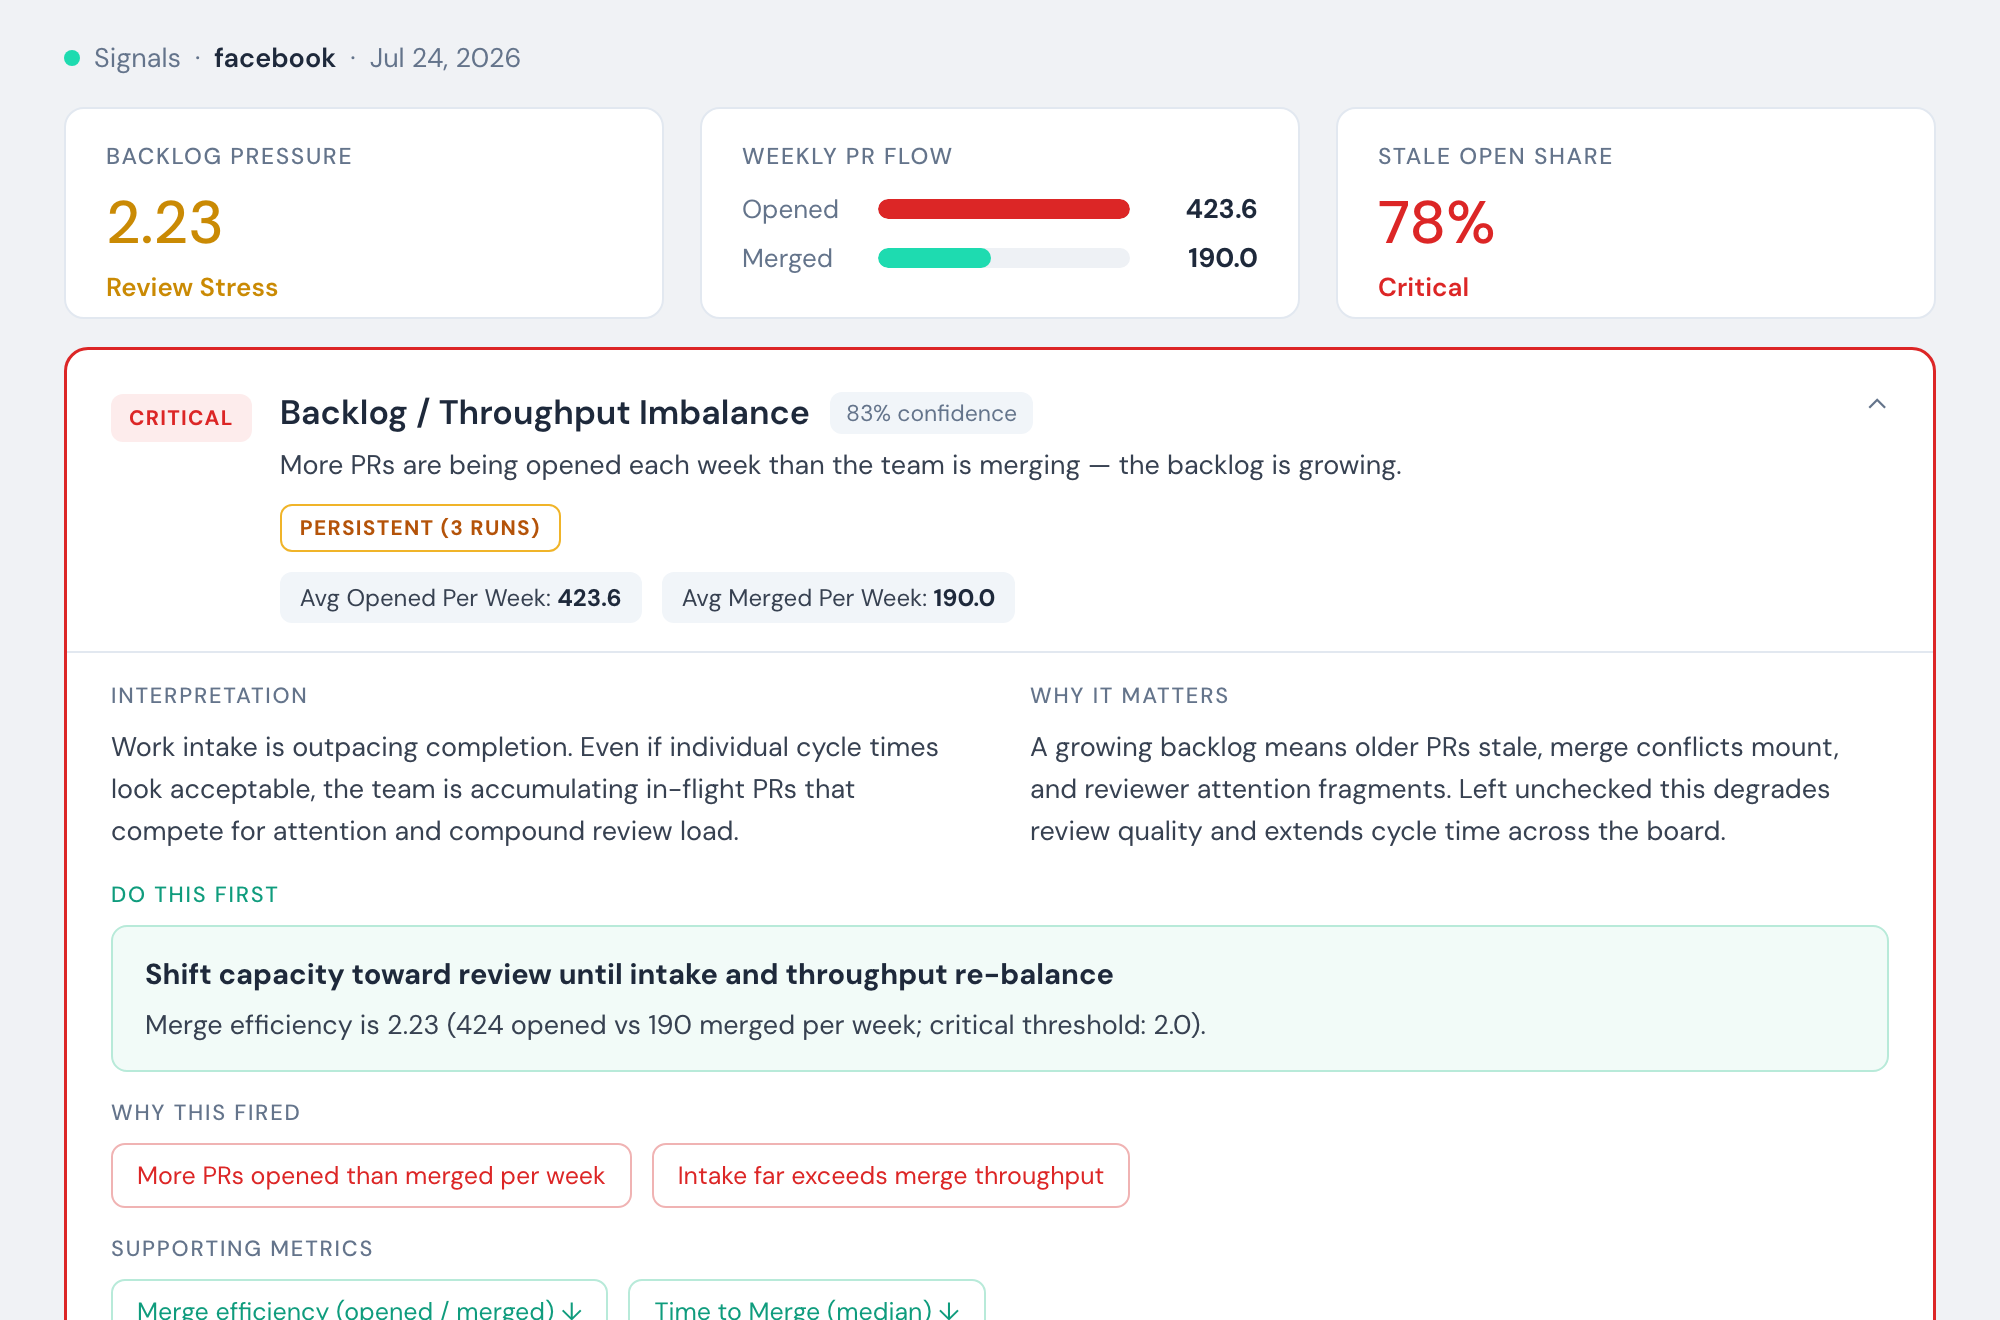
| Meta | 423.6 | 190.0 | 2.23 | 5.8 h | 10.1 h | Critical |
| Vercel | 727.2 | 379.8 | 1.91 | 49 min | 2.9 h | High |
| Kubernetes | 353.0 | 188.0 | 1.88 | 5.9 h | 11.8 h | High |
| Google Cloud | 1,064.2 | 600.6 | 1.77 | 17 min | 2.6 h | High |
| AWS | 763.8 | 493.4 | 1.55 | 1.2 h | 5.2 h | Medium |
| Apple | 239.2 | 156.2 | 1.53 | 2.4 h | 7.8 h | Medium |
| Netflix | 32.2 | 21.6 | 1.49 | 1.4 h | 2.4 h | Medium |
| Microsoft | 7,521.0 | 5,348.4 | 1.41 | 1.3 h | 2.4 h | Low |
| Anthropic | 606.0 | 491.2 | 1.23 | 4.8 h | 6.1 h | Low |
Live data from git-quick.dev/showcase.
Across all seventeen organizations currently in the showcase, not one sits below the 1.2 warning line, and four are above the 2.0 critical line. Part of that is a fact of open source: external contributions often get closed rather than merged, and the most visible repositories attract the most drive-by PRs. React's 58-opened-vs-10-merged ratio says more about inbound attention than about its maintainers' review speed — and its ~1-minute typical first review is largely automation, since 48% of reviews on that run came from bots and 44.9% of merges had no human review at all. But the unmerged remainder still becomes real open backlog, and GitQuick can show you exactly how much of it is going stale.
For Microsoft, the Stale Open PRs signal counted 10,863 open PRs, 74.8% of them with no review activity for 72+ hours. Kubernetes, at merge efficiency 1.88, carries 990 open PRs with 83.1% stale; Vercel's 2,084 open PRs are 83.6% stale. Backlog imbalance and stale PRs are the same story told from two angles: intake outruns output, and the overflow sits untouched. For idle share of the open set, see GitHub Capped Open Pull Requests. The Stale Queue Is Still Invisible.
Does review latency predict backlog growth?
You would expect it to. If reviews are slow, PRs should pile up; if they're fast, the queue should drain. Across the seventeen showcase orgs, that relationship is close to absent.
Ranking all seventeen by merge efficiency and by latency produces a rank correlation of roughly −0.02 against typical time to first review and +0.07 against typical merging time. That is noise, not a relationship. The tails do slightly better — P90 first review gives about +0.29 — which fits the intuition that a heavy tail of ignored PRs is what actually accumulates, but at n=17 it is a hint, not a finding. Treat the direction as suggestive and the medians as the real result: on this sample, knowing how fast a typical PR gets reviewed tells you almost nothing about whether the queue is growing.
The individual cases show why. Google Cloud has the second-fastest typical first review in the table and still runs at 1.77. Vercel reviews in under an hour and merges in under three, at 1.91. Netflix is fast on both stages and sits at 1.49. Meanwhile Anthropic's typical first review, at 4.8 hours, is slower than every org in the table except Meta and Kubernetes — and it has the lowest merge efficiency of the seventeen at 1.23, plus the tightest tail in the whole showcase: a P90 first review of 10.3 hours against that 4.8-hour median. Its reviews aren't quick; they're consistent, and almost everything opened gets merged.
The practical reading: latency and merge efficiency are measuring different constraints. Latency measures how long a PR waits for attention it eventually gets. Merge efficiency measures whether there is enough attention to go around at all. A team can fix the first with faster reviewer response and leave the second completely untouched — which is why a dashboard full of green medians is not evidence that the queue is under control.
The Backlog / Throughput Imbalance signal
You don't need to compute this ratio by hand. GitQuick's Backlog / Throughput Imbalance signal watches it on every org run and fires on the two thresholds above. When it triggers, the card's Why this fired chip shows the exact numbers behind it. On the Meta run in the table, the primary recommendation reads:
Shift capacity toward review until intake and throughput re-balance — Merge efficiency is 2.23 (424 opened vs 190 merged per week; critical threshold: 2.0).
At the warning level the primary action shifts to "Prioritise clearing the oldest open PRs before accepting new ones," carrying the same evidence-aware rationale — on the current Google Cloud run, "Merge efficiency is 1.77 (1,064 opened vs 601 merged per week; warning threshold: 1.2)." Its secondary actions are explicit about the decoupling this post is about: "A growing backlog increases context decay even when individual cycle times look fine." The rest of the list moves from investigating whether one author or repo is driving the imbalance to revisiting reviewer allocation and WIP limits if it persists — ordered from "drain the queue now" to "change the structure that keeps refilling it."
One run of this ratio is a snapshot; backlog growth is a trend. Severity labels move as intake fluctuates, so a single "high" reading tells you less than the same signal appearing three weeks running. That's where cross-run badges matter: a signal tagged Persistent (3 runs) is a structural capacity problem, not an end-of-sprint surge. Scheduling weekly runs is what separates the two.
What to do this week
Backlog imbalance has a different fix than slow reviews. Adding reviewers to a fast-median team may not help if the real issue is intake volume.
- Measure opened vs merged per week, not just cycle time. If the ratio is above 1.2 and staying there, your queue is growing regardless of how fast individual PRs move.
- Drain before you refill. Prioritise clearing the oldest open PRs before accepting new work — stale PRs compound review load and merge conflicts across the whole backlog.
- Find the source of the spike. Persistent imbalance usually traces to one team, one repo, or one release crunch. Scope the signal to a repo group to find it.
- Pair it with stale-PR hygiene. A growing backlog and a wall of idle open PRs are the same problem. A weekly triage ritual — close, convert to draft, or re-request review — keeps the overflow from calcifying.
- Consider WIP limits if it's structural. If intake outpaces output run after run, the fix is capacity or a cap on work-in-flight, not another SLA.
This complements the segments you already track. Slow first review is a reviewer-capacity story (pull request review latency). Slow approval-to-merge is a pipeline story (Your PRs Are Approved. Why Aren't They Merging?). Backlog imbalance is a volume story — and GitQuick rolls all three into the Signals playbook so you fix the right one.
See it on public orgs first
The Showcase is the fastest way to calibrate your intuition. Open any org, put opened-per-week next to merged-per-week, and watch how often the gap is wide even when the typical merging time looks great.
Then run it on your own org. Your PRs might be moving fast. The question is whether more of them are arriving than leaving.
Showcase metrics are derived from public GitHub metadata only. They reflect review-process signals, not code quality or internal engineering culture. Figures come from one-month showcase windows of July 2026 and will change as underlying data refreshes. Rank correlations are Spearman coefficients over the seventeen organizations in the showcase as of 29 July 2026 — a small sample, reported as observation rather than proof. Signal thresholds are documented in the Signals Guide. GitQuick is not affiliated with or endorsed by the organizations featured.