Your Cycle Time Is One Number. Your PR Pipeline Has Four Stages.
A July 2026 CMU/Stanford study of 196,212 pull requests had to split the wait into stages before it could say where delivery time actually goes. GitQuick's Pipeline view does the same per org — and across eighteen public showcase orgs, the stage that looks fastest is often just the one with the most bots in it.
By Ahmad Hajjar
Cycle time tells you how long a pull request took. It never tells you where the time went.
That gap matters more now. When a team opens a lot more PRs, the total wait usually gets worse — but which step slowed down is the only question that leads to a fix. Hiring reviewers, fixing CI, and splitting large changes are three different moves, and one number can't tell you which one you need.
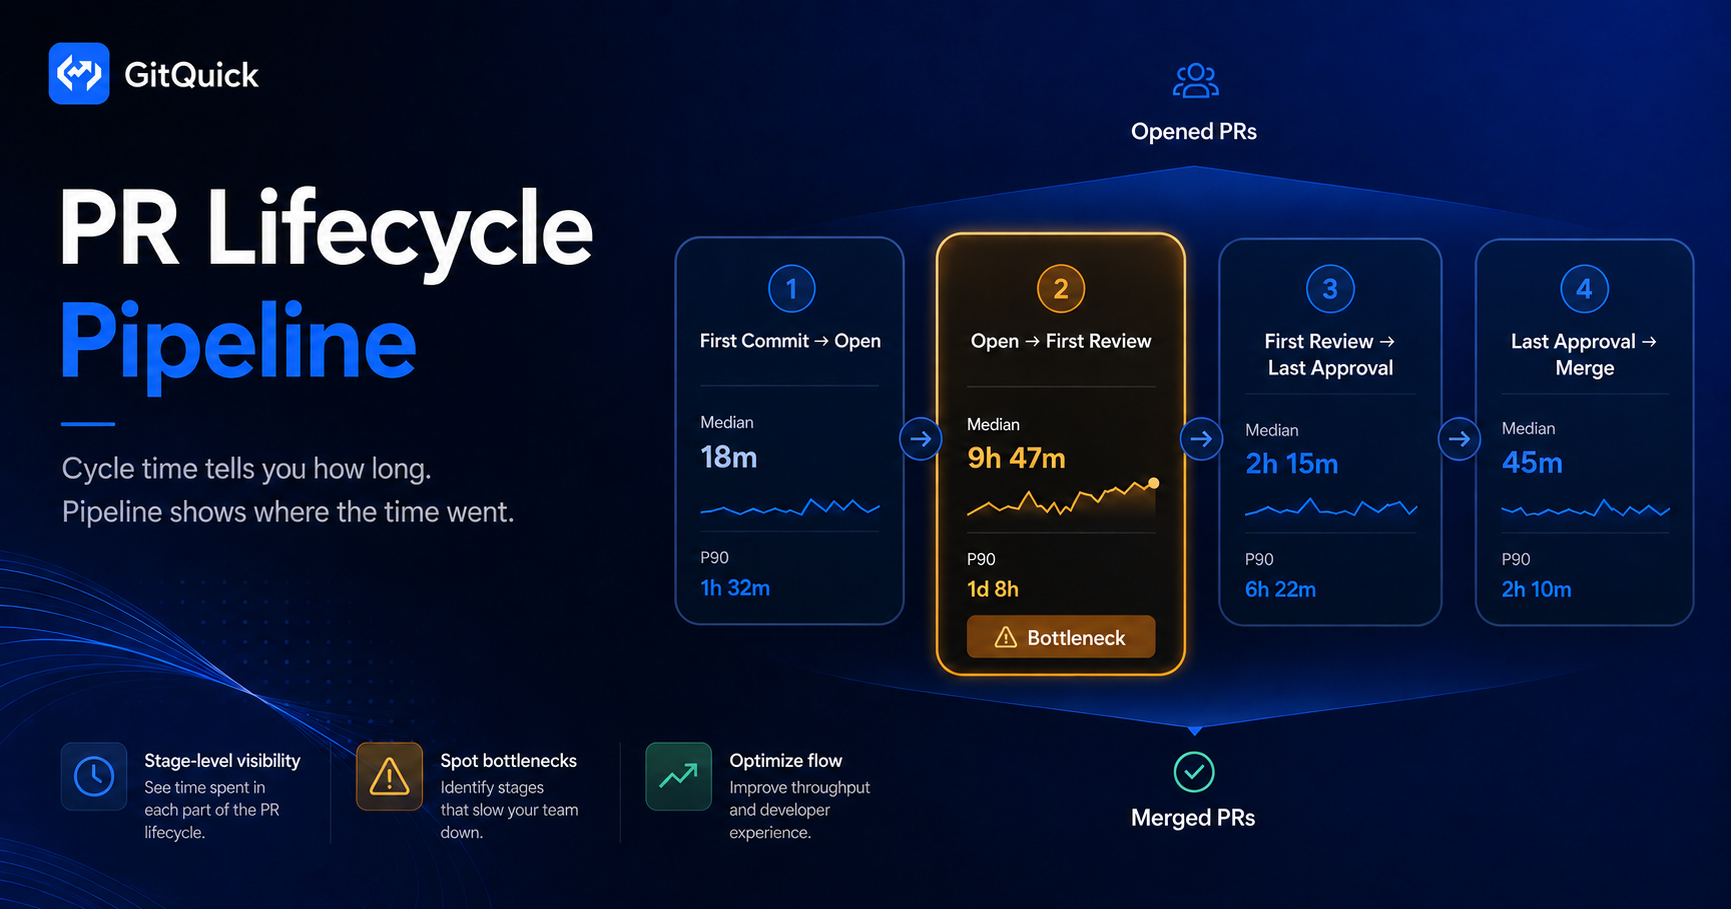
Why this matters now
In July 2026, researchers from Carnegie Mellon and Stanford published AI Writes Faster Than Humans Can Review. They studied a company that pushed engineers to roughly double their output. Across 802 developers and 196,212 pull requests from January 2024 to April 2026, PRs per person rose to 2.09× what it was before that push.
The useful part of the study is how they measured. To see what that doubling cost, they broke the wait into steps — first commit to PR opened, opened to first review, and first review to merge — because, in their words, that split "lets us locate where in the pipeline time accumulates."
What they found was pressure on reviewers. The number of people reviewing grew about 1.5×, but each reviewer's load roughly doubled. PRs with at least one human review fell from 89% to 68%. PRs with an automated review rose from about 19% to about 84%. Merge and revert rates stayed about the same. Their takeaway is the line to put above a dashboard:
A single throughput number captures the speed and hides that shift.
LinearB's 2026 Software Engineering Benchmarks Report — 8,109,244 pull requests from 4,813 teams and 163,820 contributors across 42 countries — says the same thing from the other direction. It reports coding, pickup, review, merge, and deploy time separately. Cycle time, it says, "is the sum of the phases above it, so it should be read as a result rather than as a target." Compare the steps, not the total, "because a cycle time gap cannot tell you which handoff to change."
The same report found that 44.7% of surveyed organizations don't formally measure AI's impact at all, while 76.1% of leaders say AI has improved productivity. In other words, many teams believe delivery got faster without measuring the stages that would show where the time actually went.
The four stages GitQuick measures
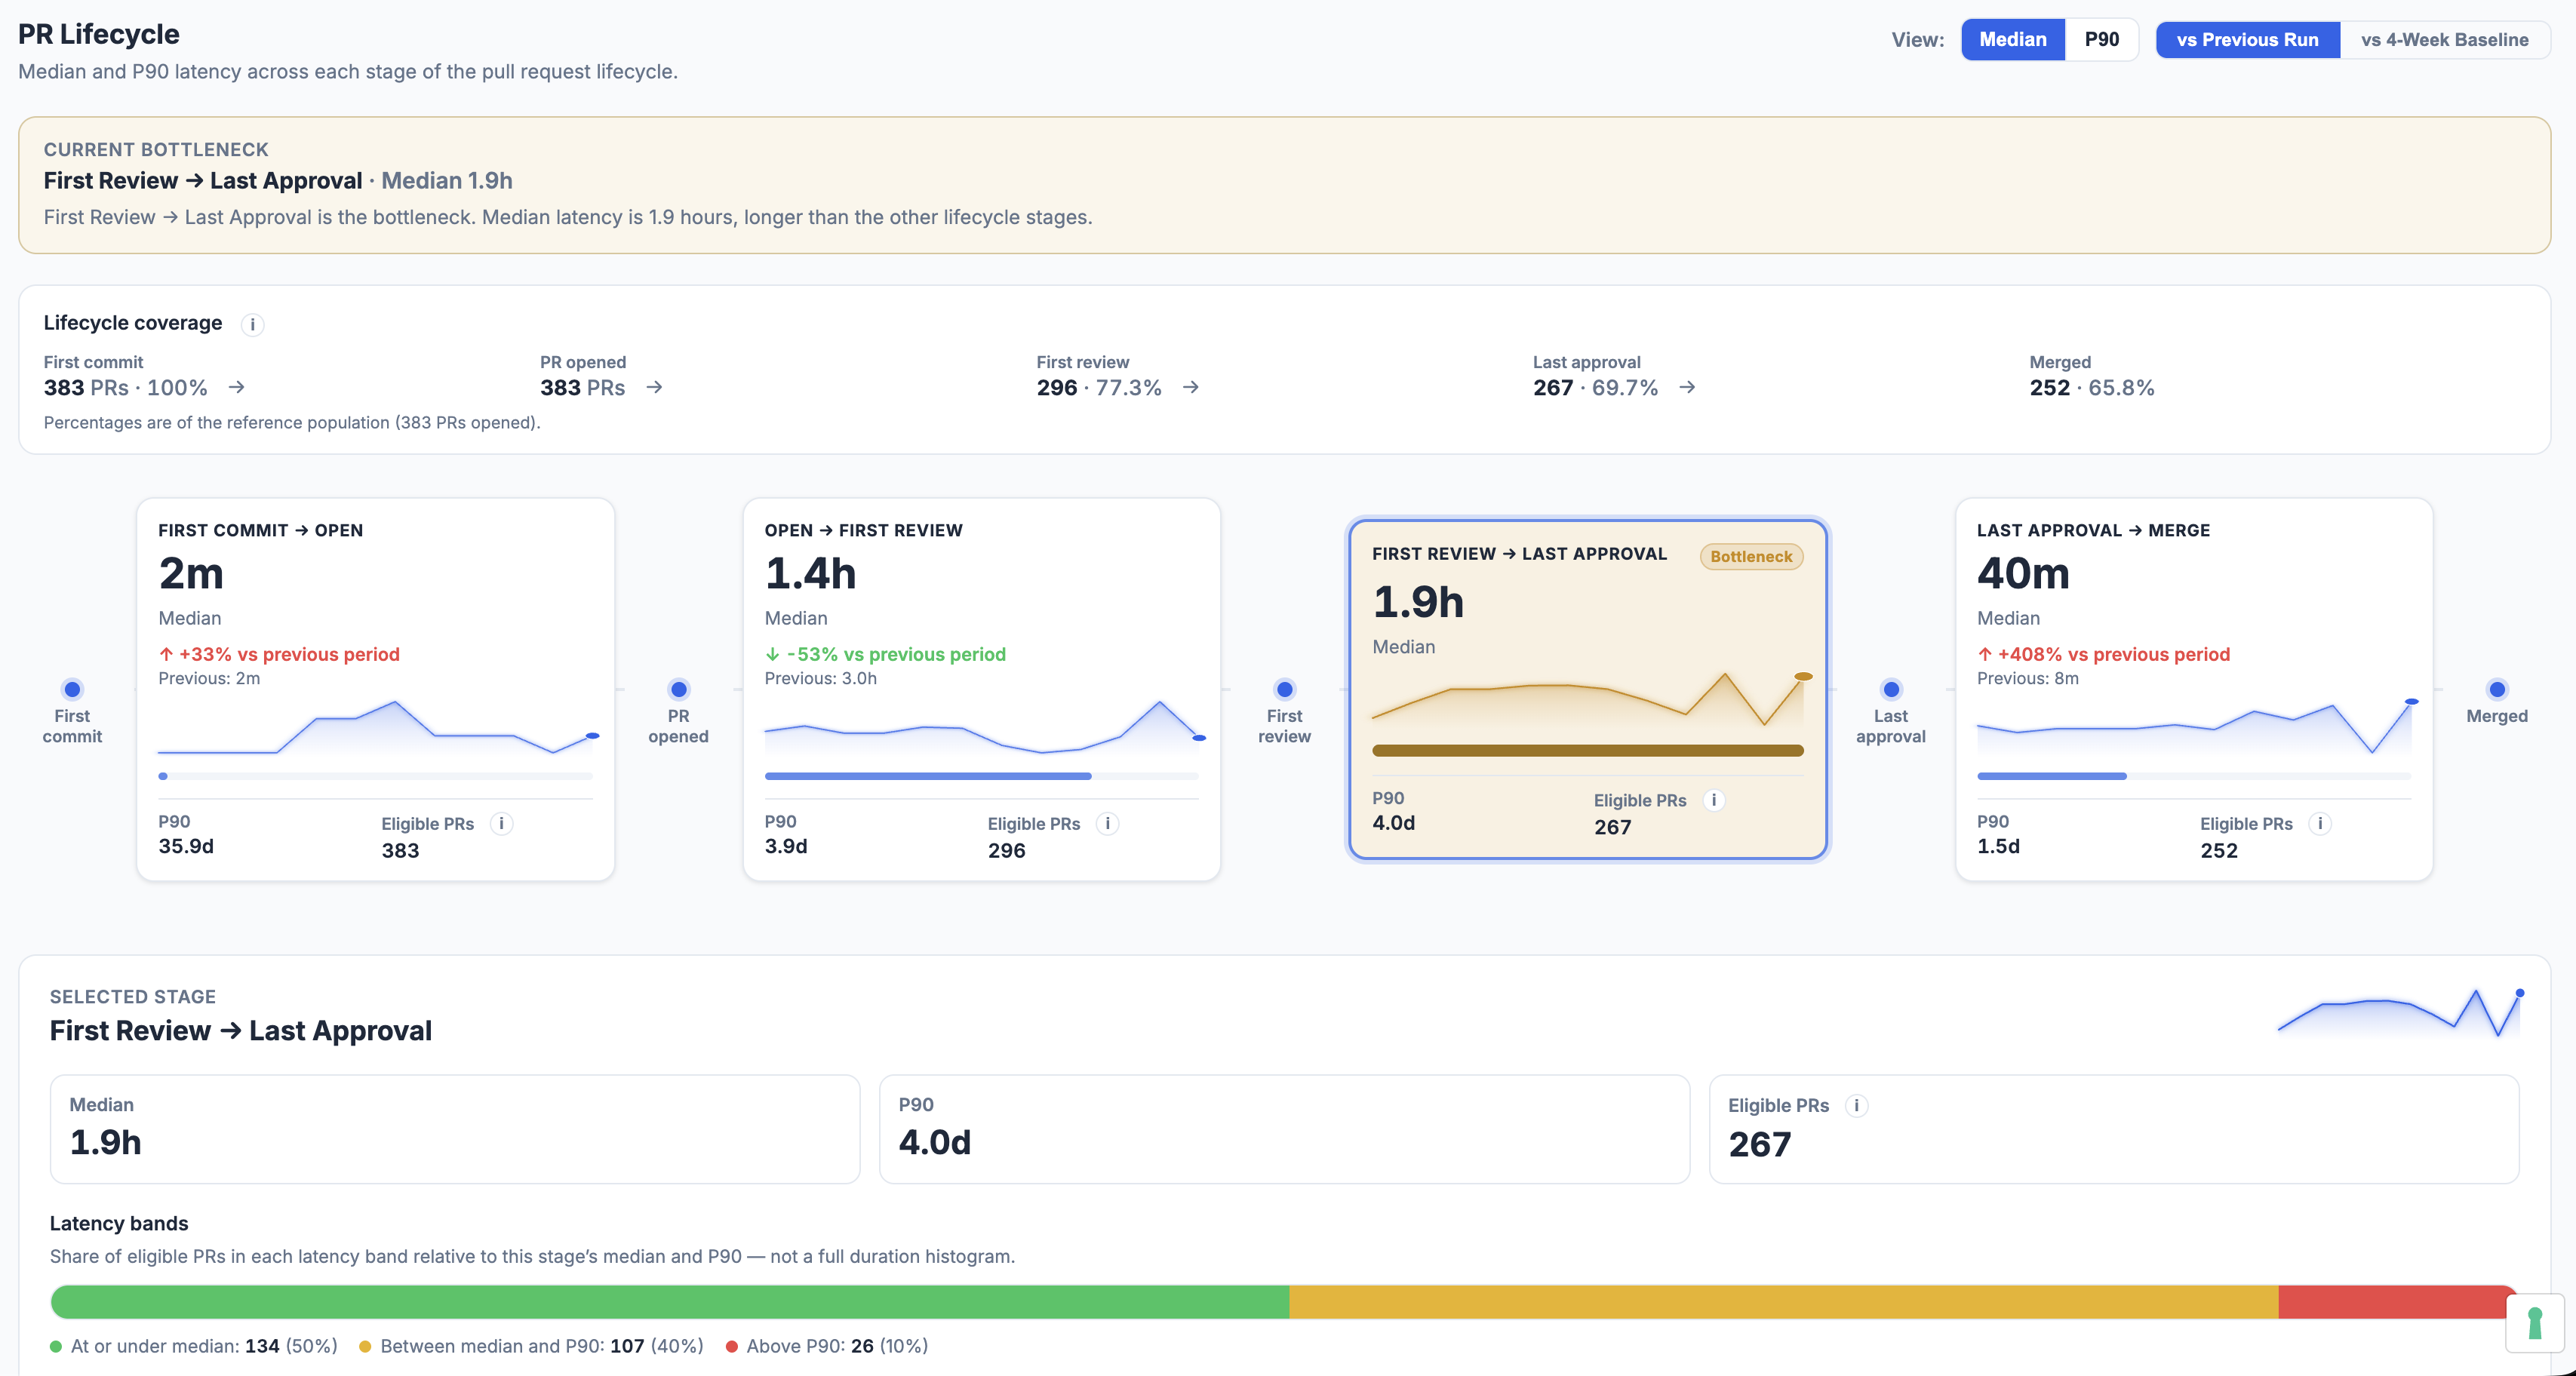
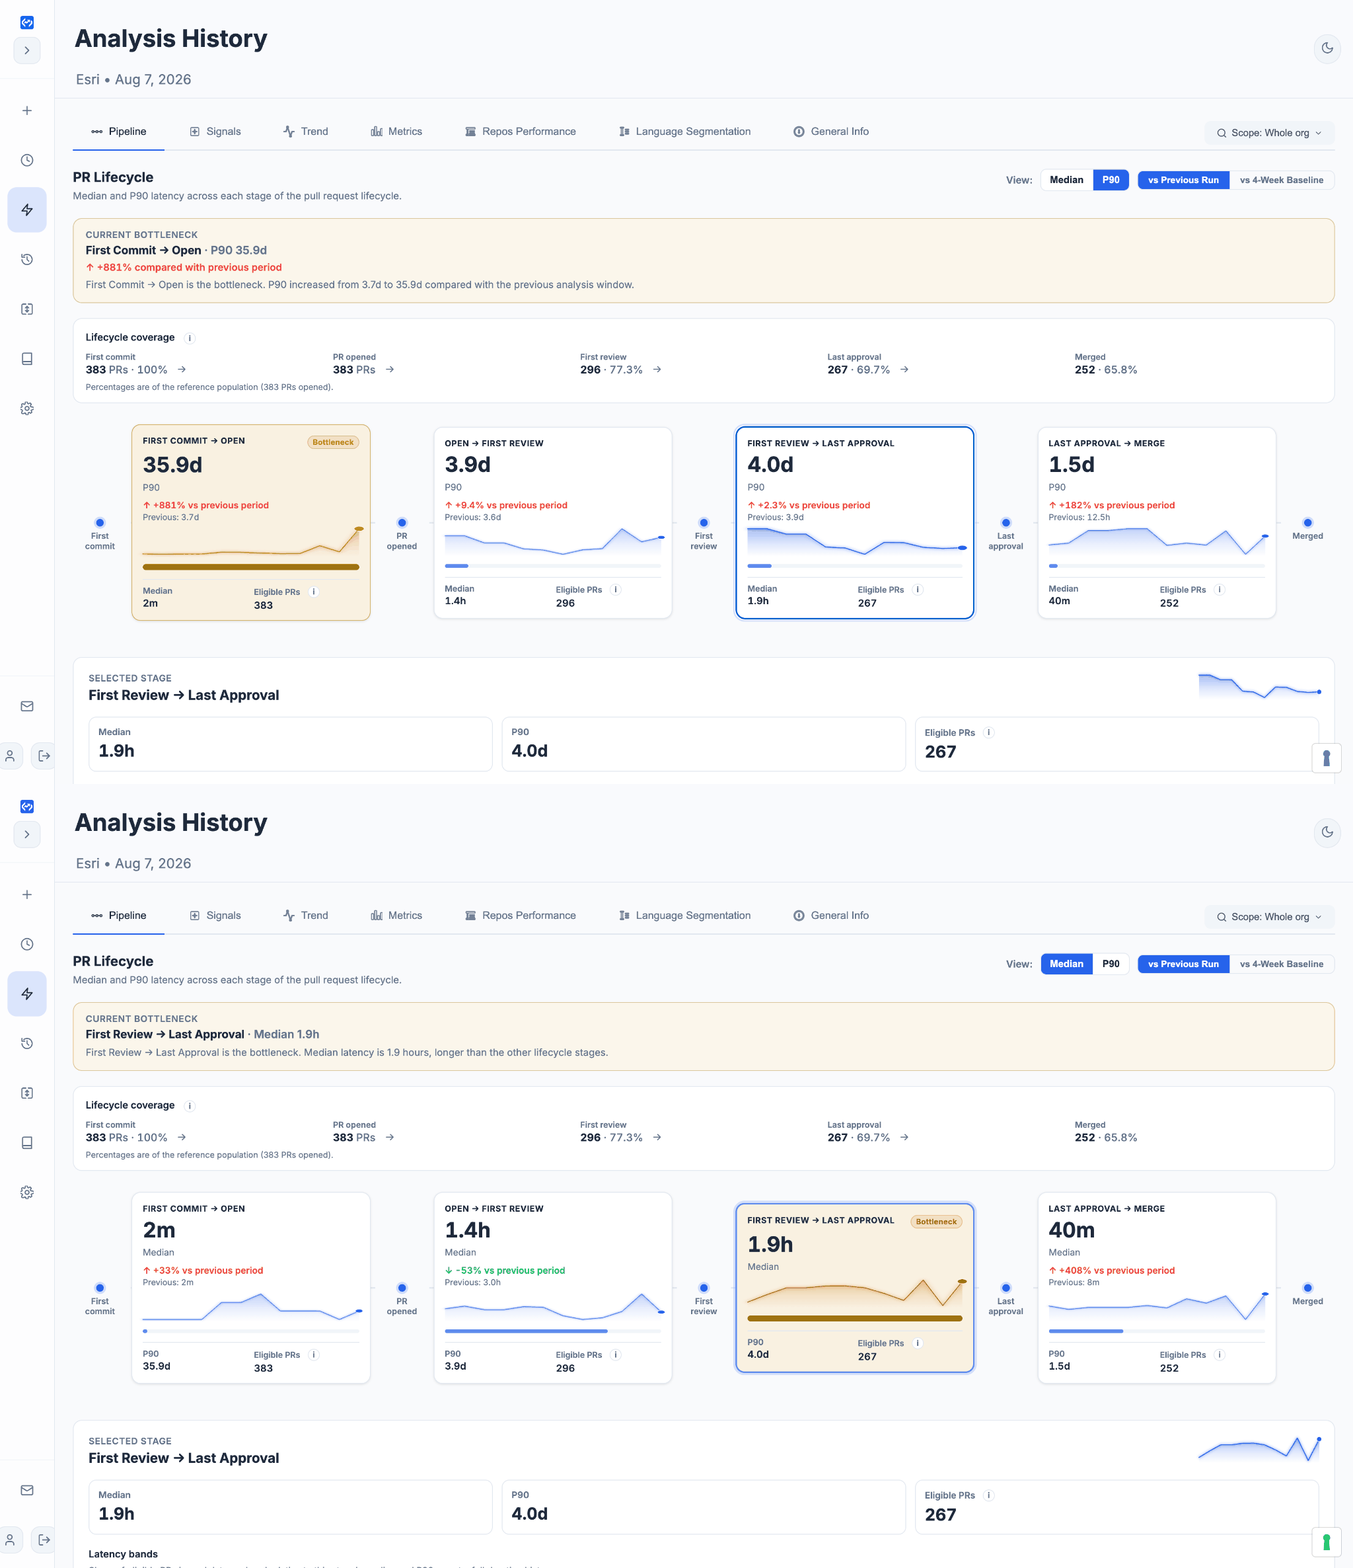
GitQuick's Pipeline (PR Lifecycle) view splits every PR in an analysis window into four steps:
First Commit → Open
Open → First Review
First Review → Last Approval
Last Approval → Merge
Each step has its own median, P90 (the wait that 90% of PRs beat), and PR count. The slowest step is labelled Bottleneck automatically — with a short line saying whether it moved, for example "Open → First Review remains the bottleneck. Median increased from 5.0h to 5.1h compared with the previous analysis window."
A PR only counts toward a step when the timestamps for that step exist and the wait is not negative. That has a consequence most dashboards skip past.
You cannot get cycle time by subtracting medians
Here is a real example from GitQuick's public showcase. In Netflix's one-month window ending 4 August 2026, the median wait for a first review was 7.7 hours — while the median time from open to merge was 2.9 hours. If you treat those as stacked pieces of one bar, that looks impossible: one step looks longer than the whole trip.
It isn't a bug. Each step is measured on a different set of PRs. Netflix opened 152 PRs in that window and merged 93, and the PRs that merged quickly are not the same PRs that waited for review. Medians from different sets don't add up, and they don't subtract.
That is why the Pipeline view shows a PR count on every stage card and a lifecycle coverage funnel above them, instead of a bar that pretends to sum to 100%. For Anthropic's window ending 5 August 2026, that funnel reads: 2,983 PRs opened → 2,446 reached a first review (82.0%) → 2,407 reached an approval (80.7%) → 2,366 merged (79.3%). Now the 5.1-hour first-review median has a clear "of which PRs?" attached to it.
What the showcase data shows
Here are the two lifecycle stages the public showcase exposes, across twelve organizations, sorted slowest first, next to each org's bot share of total reviews.
| Org | Open → First Review (median) | P90 | Last Approval → Merge (median) | Bot share of reviews |
|---|---|---|---|---|
| Microcks | 20.4h | 172.1h (7.2d) | 0m | 3.8% |
| Meta Open Source | 13.8h | 146.4h (6.1d) | 6m | 1.0% |
| Netflix | 7.7h | 105.2h (4.4d) | 4m | 12.5% |
| Uber | 6.3h | 72.0h (3.0d) | 1.3h | 5.5% |
| Kubernetes | 5.5h | 109.2h (4.6d) | 10m | 1.7% |
| Anthropic | 5.1h | 10.5h | 2m | 1.0% |
| Rust | 5.0h | 98.5h (4.1d) | 35m | 0.4% |
| 2.5h | 92.0h (3.8d) | 23m | 10.9% | |
| Apple | 2.3h | 86.0h (3.6d) | 15m | 0.0% |
| AWS | 1.5h | 76.3h (3.2d) | 10m | 14.5% |
| Microsoft | 1.2h | 37.2h (1.6d) | 3m | 40.9% |
| Google Cloud | 0.2h | 72.5h (3.0d) | 10m | 29.8% |
Live data from git-quick.dev/showcase, one-month windows ending between 4 and 10 August 2026.
Two things stand out.
First: the long tail is its own problem. Every org here merges within about an hour of approval at the median — most within minutes — and every org except Anthropic has a first-review P90 measured in days. Anthropic is the clear counter-example: 5.1h median against a 10.5h P90 is about 2×, while Microsoft's P90 is roughly 32× its median. A slow typical wait and a fat tail need different fixes, which is why the view lets you switch between median and P90.
Second: bots move this stage. Across all eighteen showcase orgs, orgs with a higher bot share of reviews tend to show a faster first-review median (rank correlation about −0.69). That is a small sample and correlation only, and Apple breaks the pattern with 0% bot reviews and a 2.3-hour median. The reason is simple: GitQuick counts the earliest review of any kind as the first review, so a bot that comments in thirty seconds starts the clock. The CMU/Stanford authors hit the same issue and measured pickup to the first human review, because bots were about 38% of review rows in their data.
So read Open → First Review next to the bot-review share, not alone. GitQuick reports both, and the Pseudo-Bot Reviewer post covers what happens when that line gets blurry.
The org median is not the org's problem
The stage number for a whole organization mixes repos that behave nothing alike. On a 6 August 2026 whole-org run for anthropics, the org-level Open → First Review median was 5.1h. The per-repo list, sorted slowest first, opened with anthropics/buffa at 2.4 days — across 43 PRs that qualified for that stage.
Further down that list sat anthropics/claude-plugins-community at 9.7 hours across 950 qualifying PRs.
buffa is the slower repo. claude-plugins-community is the one setting the org number. Sorting by "slowest" finds the worst experience; sorting by PR count finds the biggest lever. They are rarely the same row, and acting on the first one alone is how teams spend a quarter fixing a repo almost nobody touches.
What to do this week
- Split the wait into stages before you set a target. First commit → open, open → first review, first review → approval, approval → merge. The total is an outcome, not a knob you can turn.
- Rank the gaps between stages, not the raw stage times. The biggest gap vs a peer range is usually the real bottleneck; the biggest absolute number often isn't.
- Check median and P90 on the same stage. If P90 is many times the median, you have a long-tail problem, and hiring alone won't fix it.
- Always ask "of which PRs?" If only 60% of opened PRs reach approval in the window, your approval-stage median describes a friendlier subset than the full backlog.
- Read first-review time next to bot-review share. A first-review median that improves while the bot share climbs may be measuring automation, not people responding faster.
- Drill into repos twice — by slowest and by volume. Fix the one with the PR count behind it first.
This sits next to metrics you may already track. Pull request review latency is the capacity story, approval-to-merge friction is the post-approval story, and merge efficiency is the volume story. The Pipeline view tells you which of the three you are living in this week — and the Signals playbook turns that into an action list.
See it on public orgs first
Open any org in the Showcase and look at the stages side by side before you look at any total. Notice how often the stage that looks healthiest is the one with the fewest PRs in it, or the most bots in it.
Then run it on your own org. Your cycle time is going somewhere specific. The only question is whether you can name the stage.
Showcase metrics come from public GitHub metadata only. They reflect review-process signals, not code quality or internal engineering culture. Figures come from one-month showcase windows ending between 4 and 10 August 2026 and will change as the data refreshes. The hero image and the per-repo figures come from a single whole-org analysis run dated 6 August 2026. GitQuick is not affiliated with or endorsed by the organizations featured.